

Don’t Tell Me, Show Me: Diagrams That Explain Code
In Ask for a Chart, Get a Chart, I showed how Tug draws charts. Charts are for numbers. This post is about the other kind of picture: a diagram of how a piece of code works.
The command is /explain. I give it a topic, like a feature or a flow or a directory. The AI reads the code, and then it draws a diagram so I can better make sense of the code!
The best way to show this is to use it, and I have an interesting codebase right to hand: Tug’s own. So I opened a session and asked six questions someone new to the project might ask.
Like a martinet of a parent, I said to Tug: “Explain yourself!” 🧐
How is the codebase organized?
First question: in one diagram Tug’s architecture in big blocks from the Mac app down to Claude Code. Show how all the major components are organized with respect to each other.
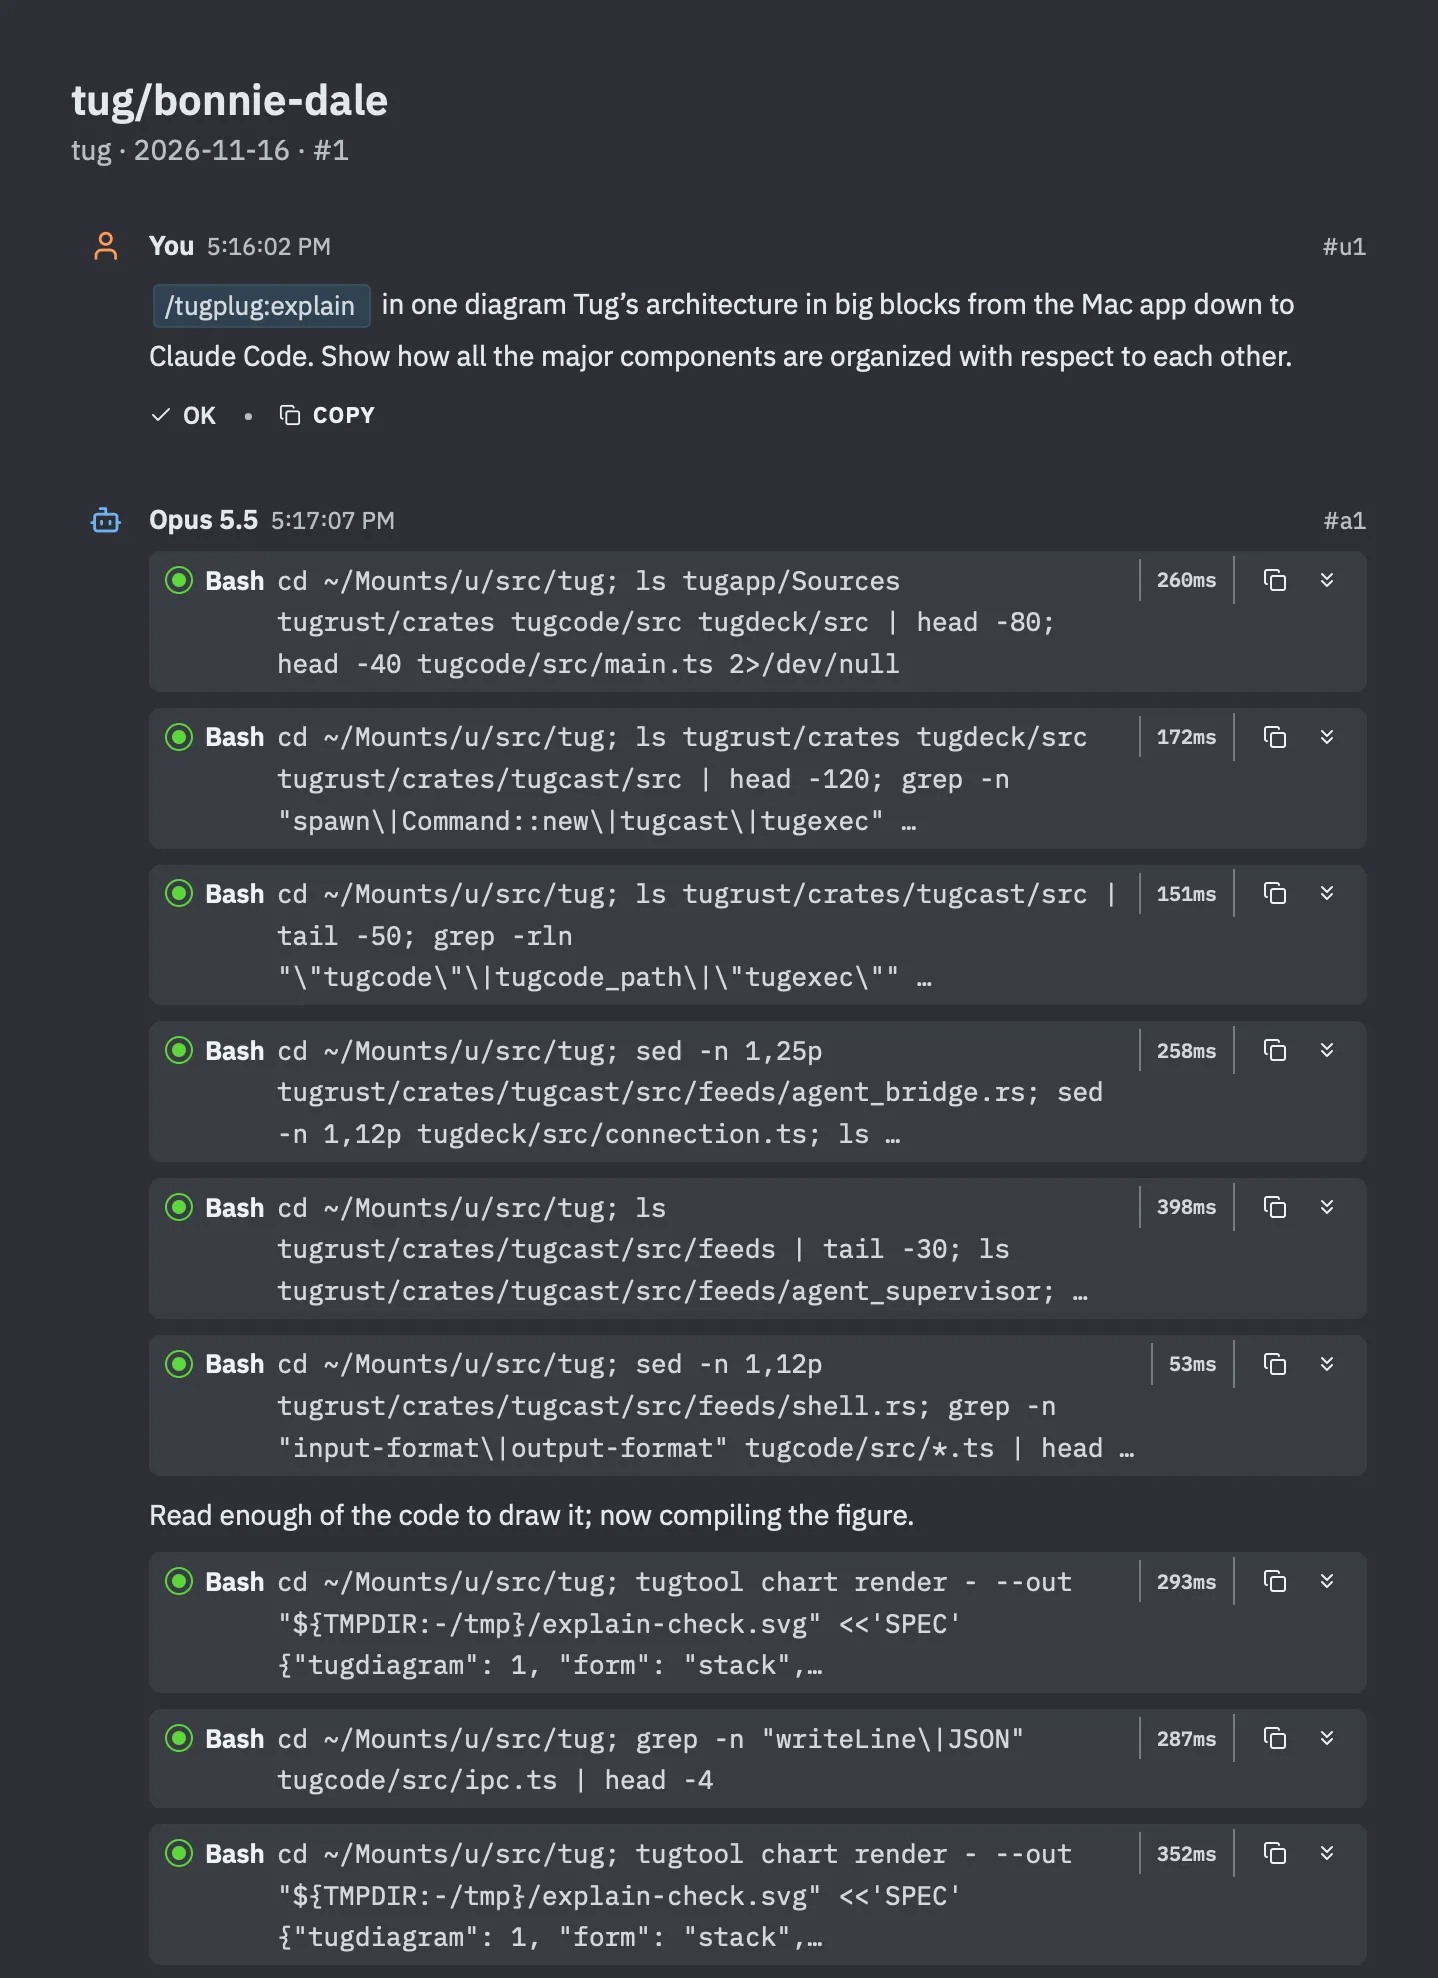
Look at what happens before any drawing. Six commands, all of them listing and searching and reading source files. That’s the rule /explain works under: read first, and only draw a part you actually found. The seventh command is a test run. The AI compiles the figure once, out of sight, to make sure it draws cleanly. Then it goes back to the code to check one label, compiles again, and only then shows me the figure.
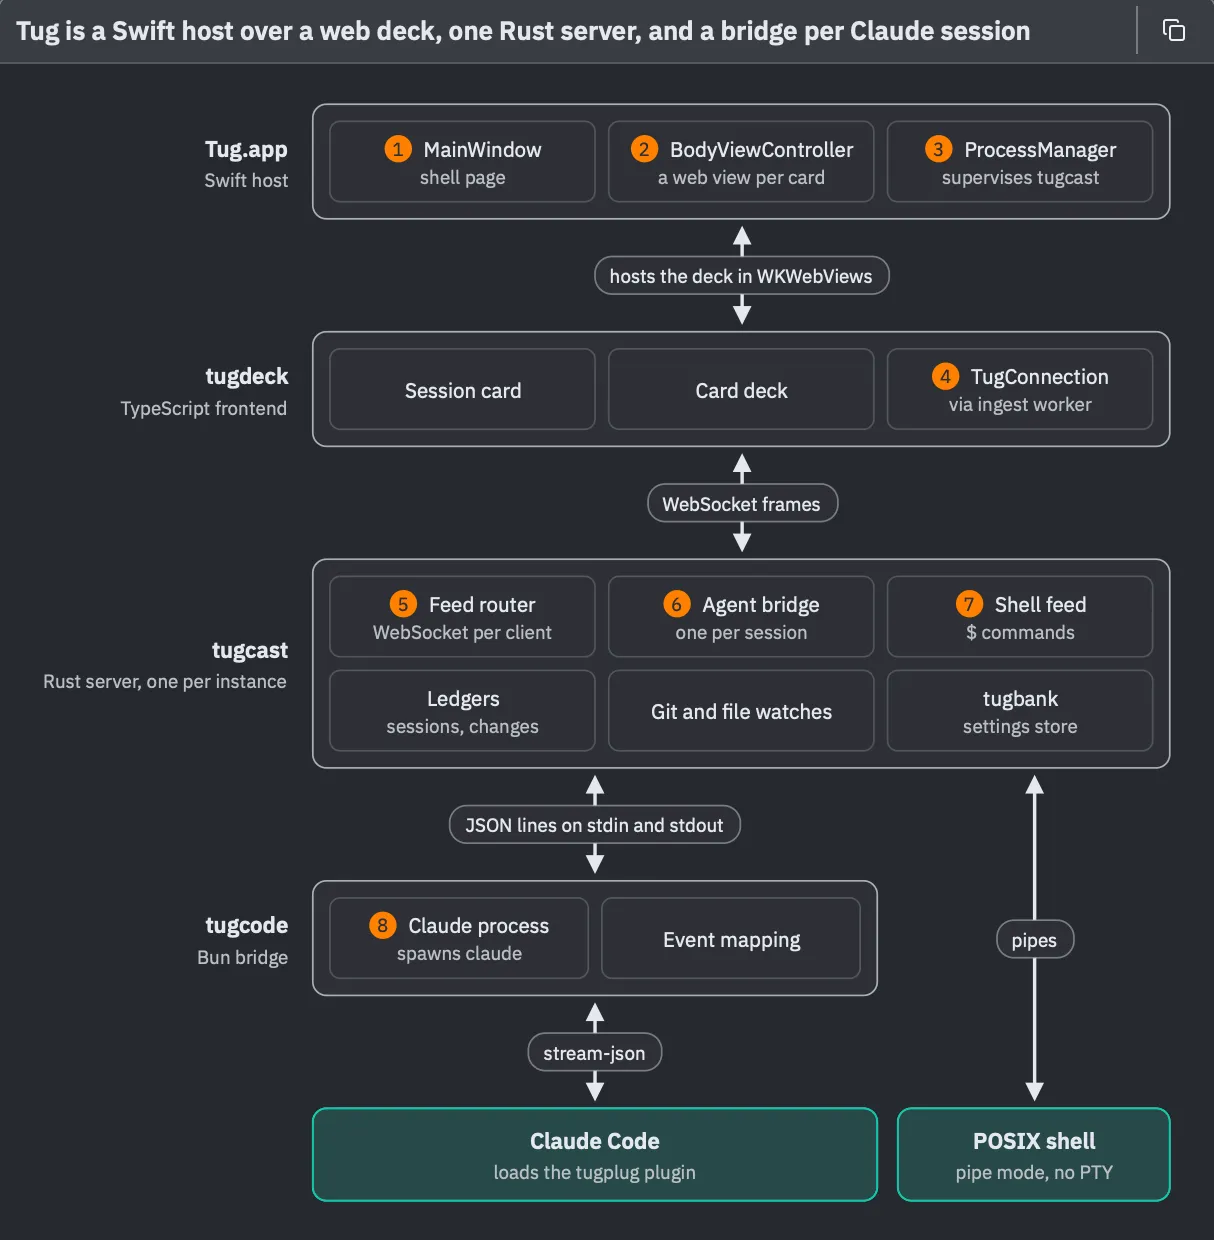
This is the stack form, the classic architecture diagram. Four layers, and each one is a separate process. The Mac app at the top is the native host. Inside its web views is tugdeck, which is everything I see in a card. Under that is tugcast, a local Rust server and the hub of the whole thing. Under that is tugcode, a small bridge, and the only part of Tug that ever starts Claude Code. The two teal blocks at the bottom are programs Tug starts but didn’t write: Claude Code on the left, and on the right, the shell that runs the commands I type into a card, wired straight to tugcast and skipping tugcode entirely. The labels between the layers name what crosses each boundary.
Two details. The title isn’t “Tug’s architecture.” It’s a sentence that says what the diagram shows: Tug is a Swift host over a web deck, one Rust server, and a bridge per Claude session. Charts in Tug do the same thing, and I like how it ties down the specifics of the diagram.
And the orange numbers give a dash of color and help your eye to land on the most salient parts of the diagram. They are the keys, and they connect to this:
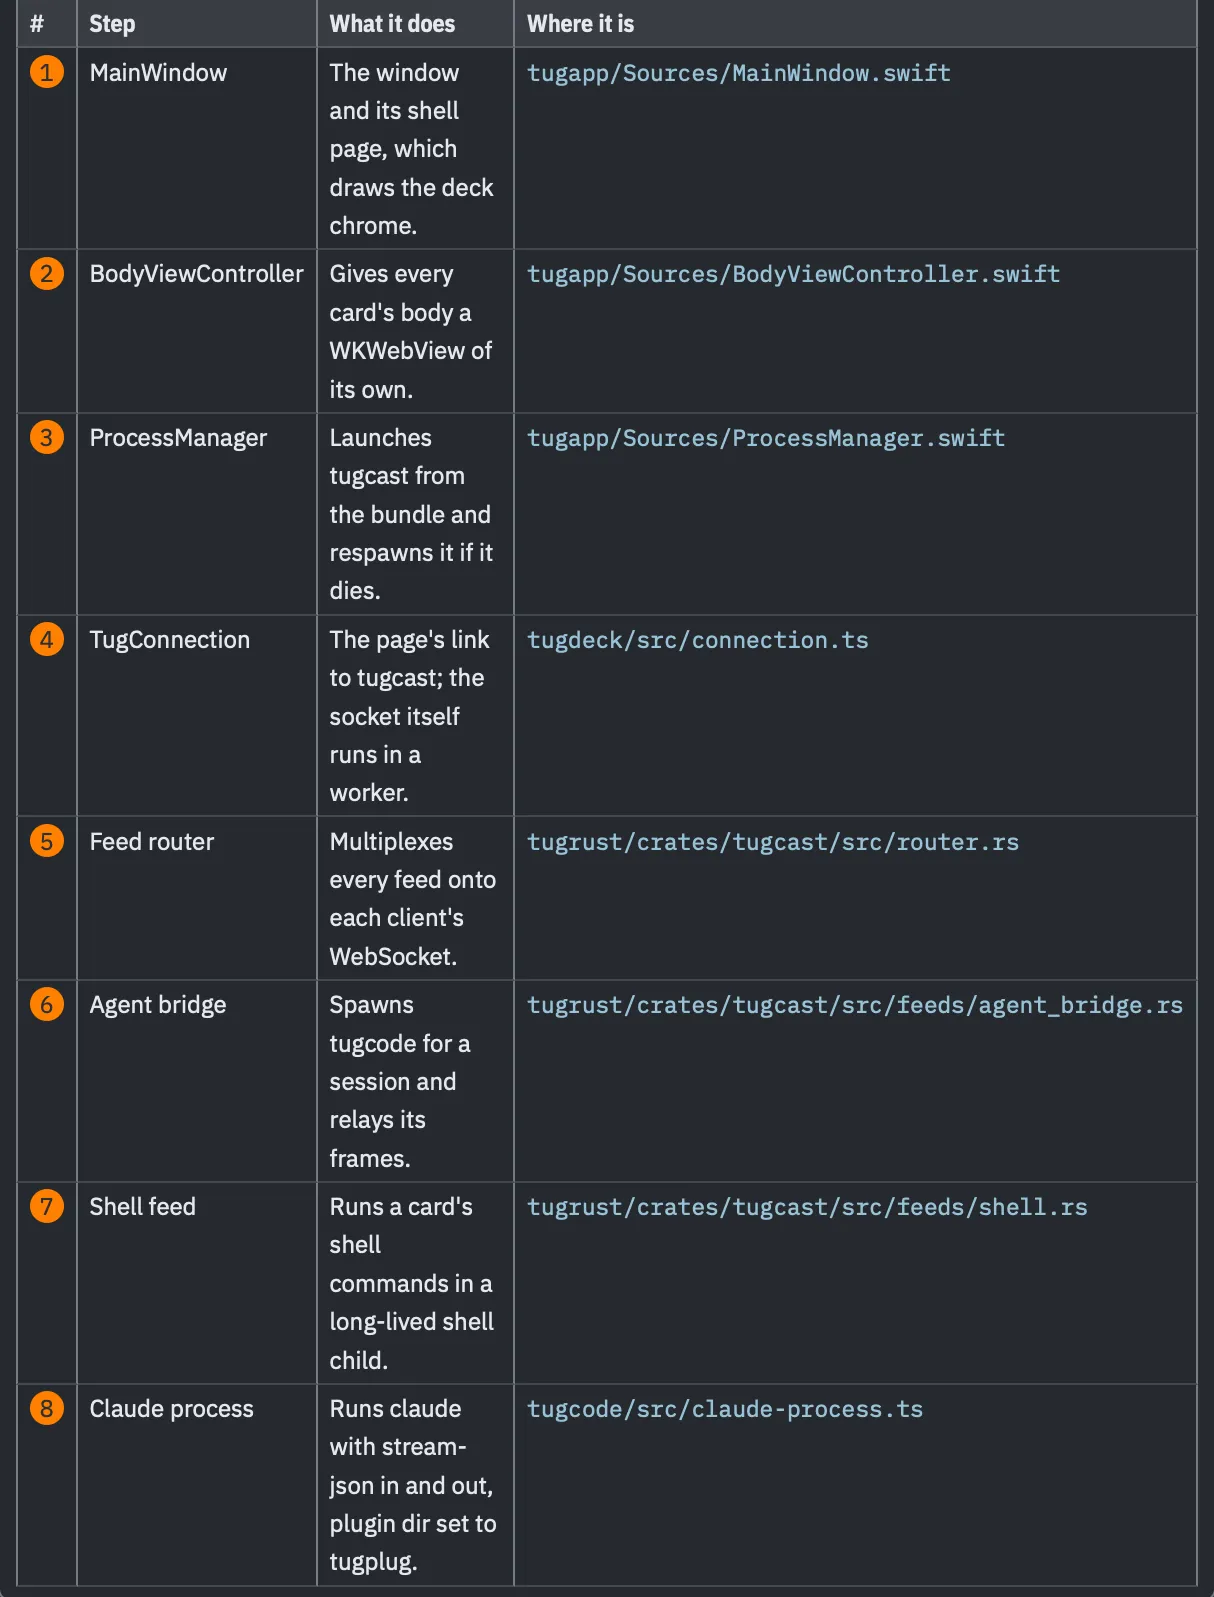
Every numbered part gets a row saying what it does and which file it lives in. In the session card, those paths are live (which, sadly, they are not in this demo/screenshot). In the real app and a real diagram, you can click one and the file opens. Tug also checks each path against the project, so a path the AI got wrong shows up as unresolved instead of as a link that goes nowhere.
That’s the piece that makes these more than pretty pictures. A diagram of code is a claim about the code. It’s a live tool to help in exploration.
Here’s what that click looks like. I pressed the path in row 1, and the file opened in a card of its own, ready to read:
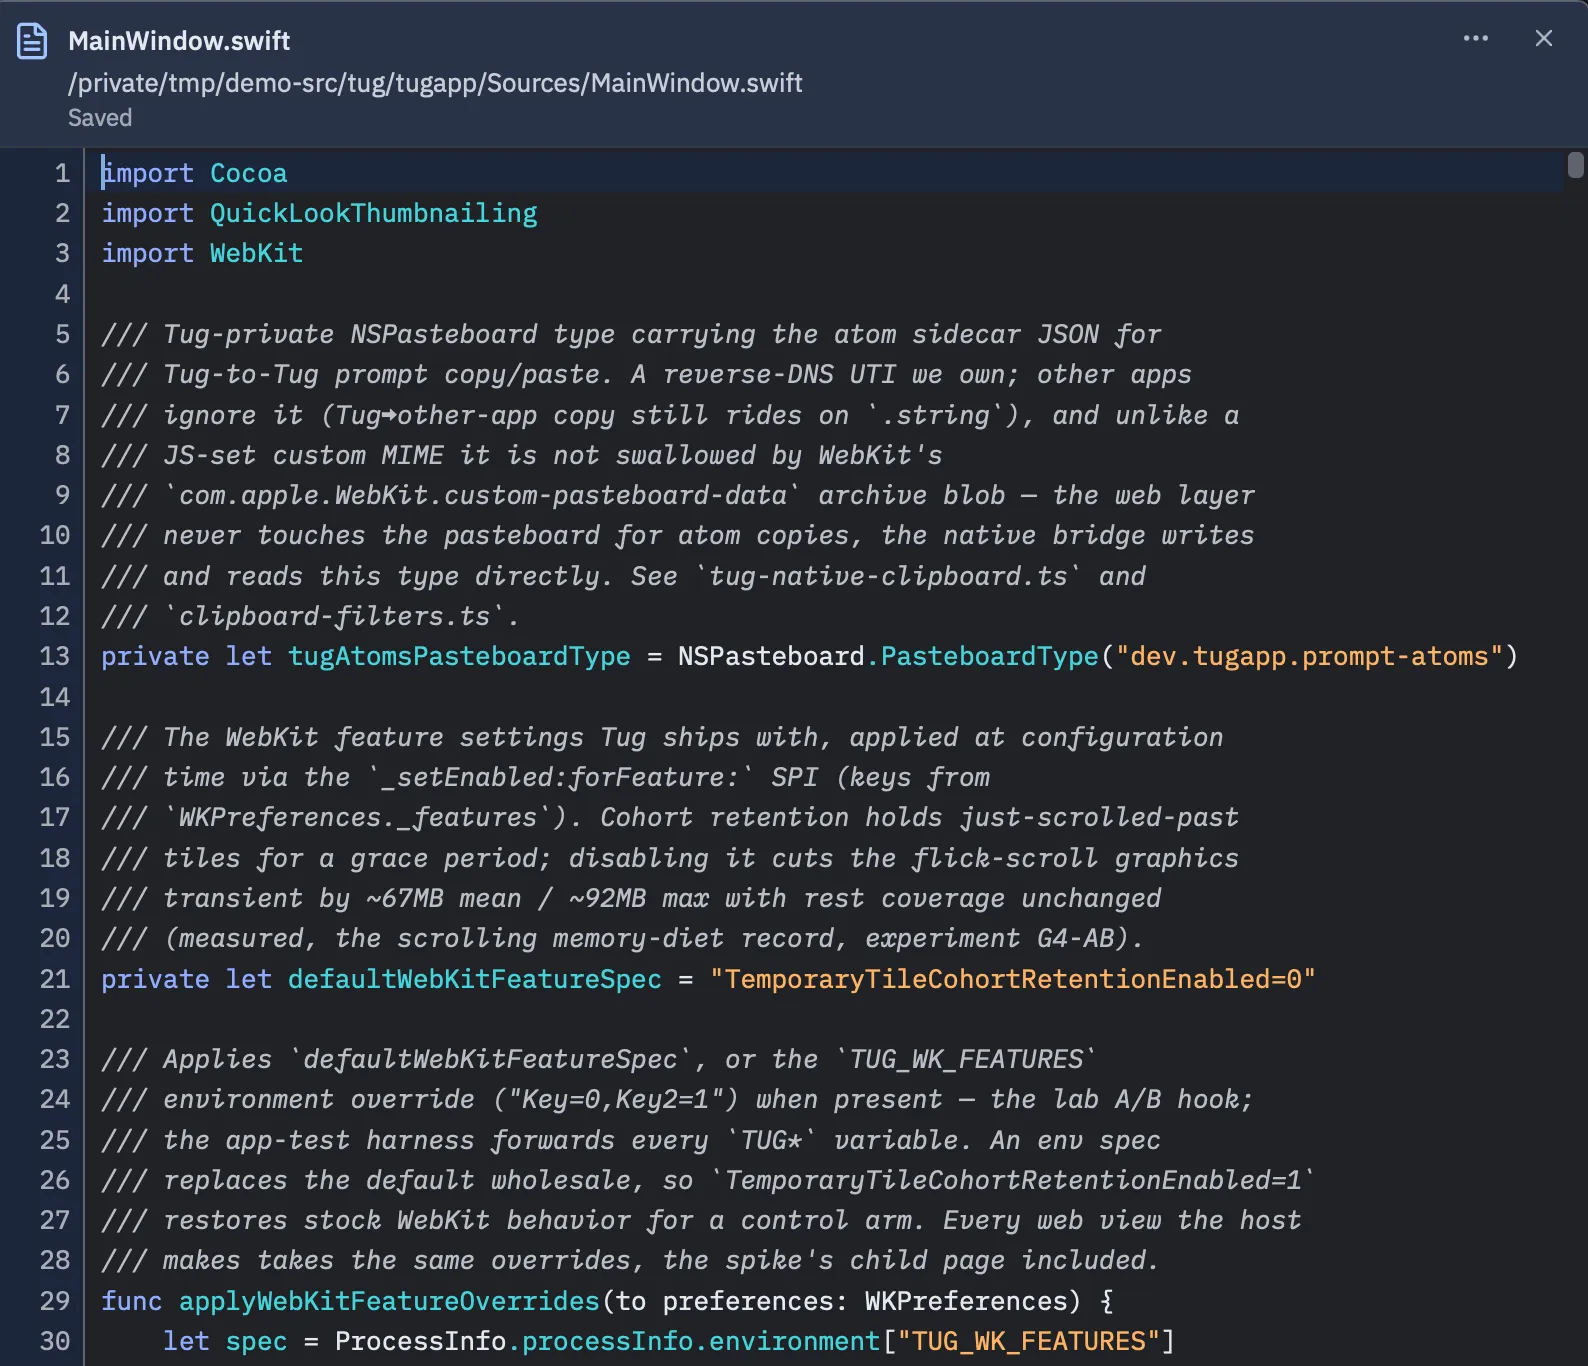
So the figure is the overview, the table is the index, and the code is one click away.
Where does everything live?
The architecture shows the modules in the codebase. It’s a useful next thing a newcomer might need. Where to find things: what’s inside the Tug repository: what each part contains. As a tree.
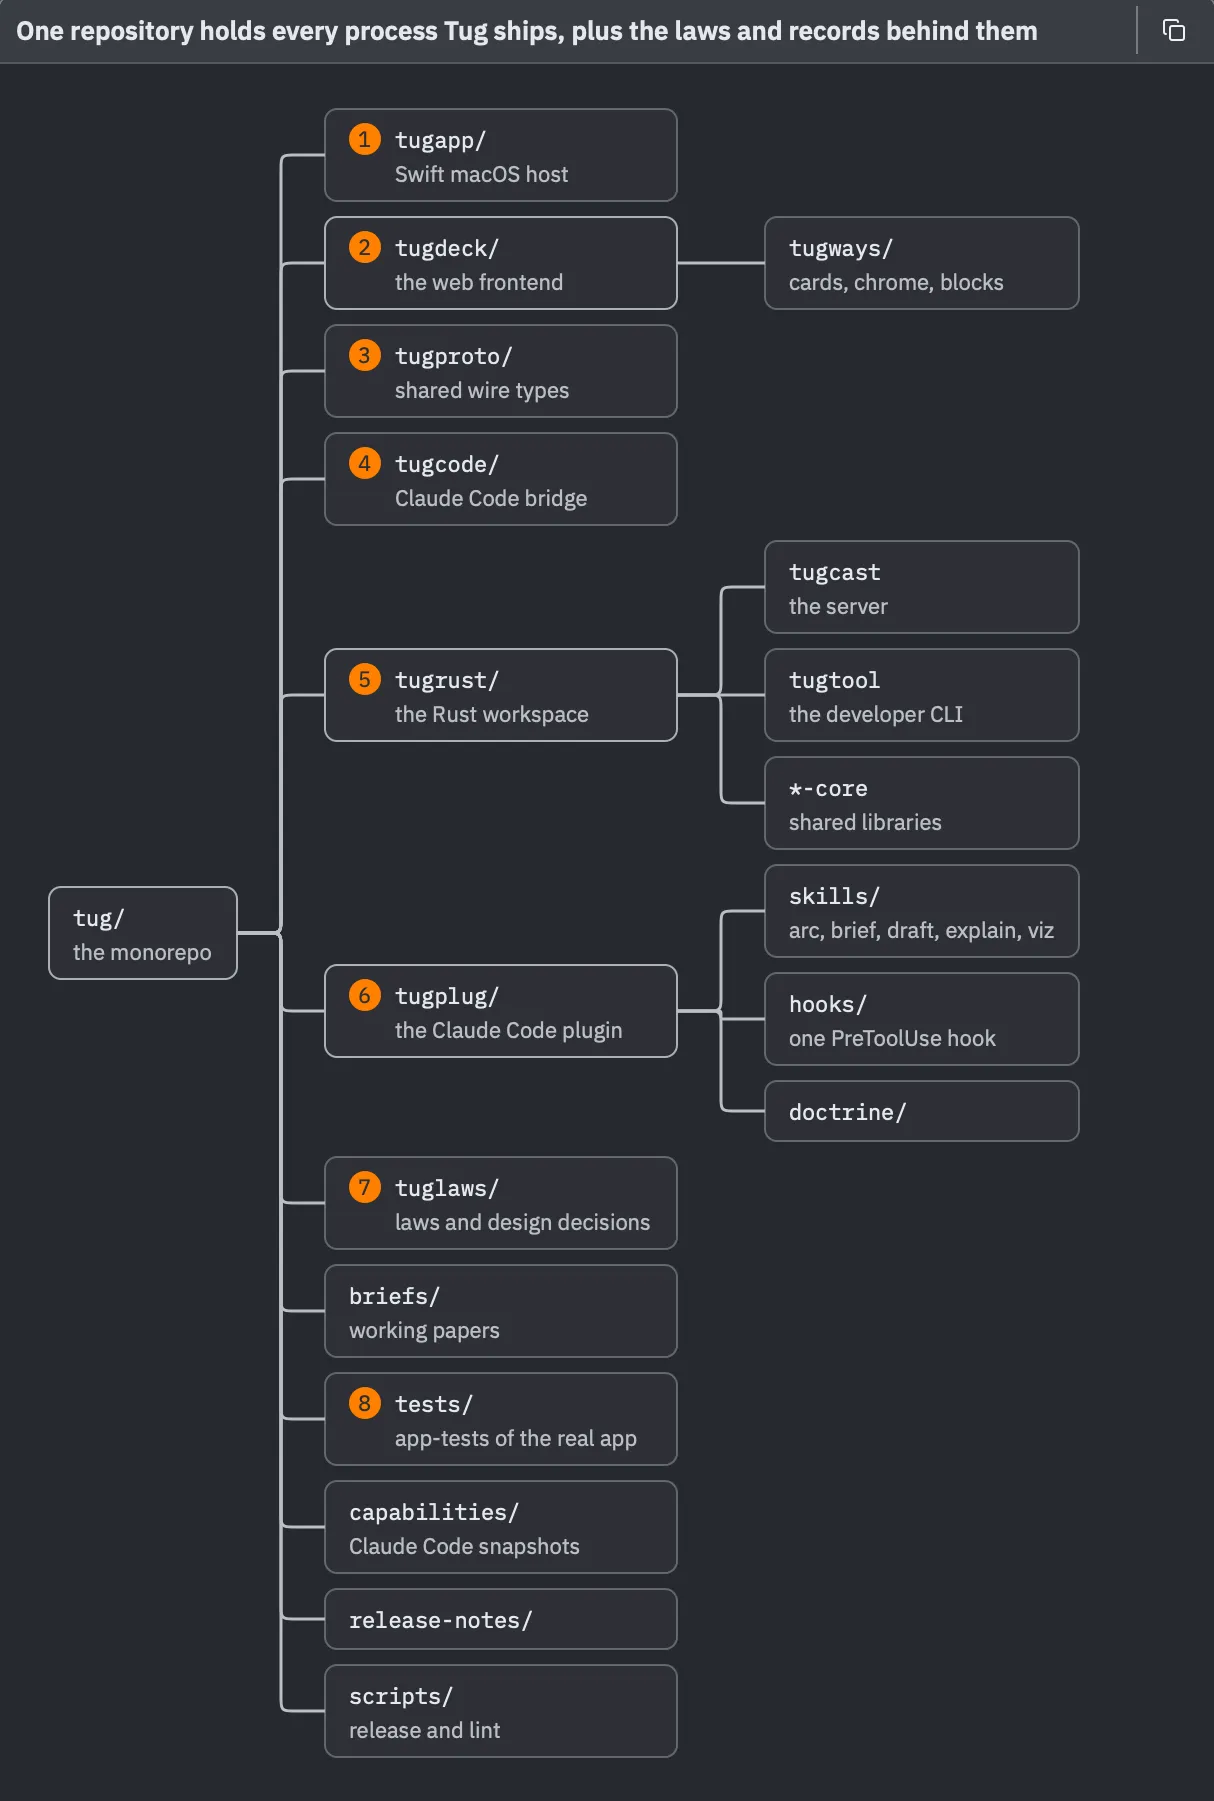
This is the tree form, for containment. The root is at the left, and each column to the right is one level deeper. The first six folders line up with the architecture one to one: the Mac app (1), the web front end (2) and its shared wire types (3), the bridge to Claude Code (4), the Rust workspace (5) and the plugin that brings Tug’s skills into every session (6). After them come the records: the rules the code is held to (7), the working papers, and the tests that drive the real app (8).
The text under the figure added something I’d want any newcomer to know. tugcast and tugtool are only two of many Rust crates, and most of the real logic lives in the shared core libraries that both of them link.
What happens when I press Return?
Next, something with time in it: what happens between pressing Return on a prompt and the first word of the answer.
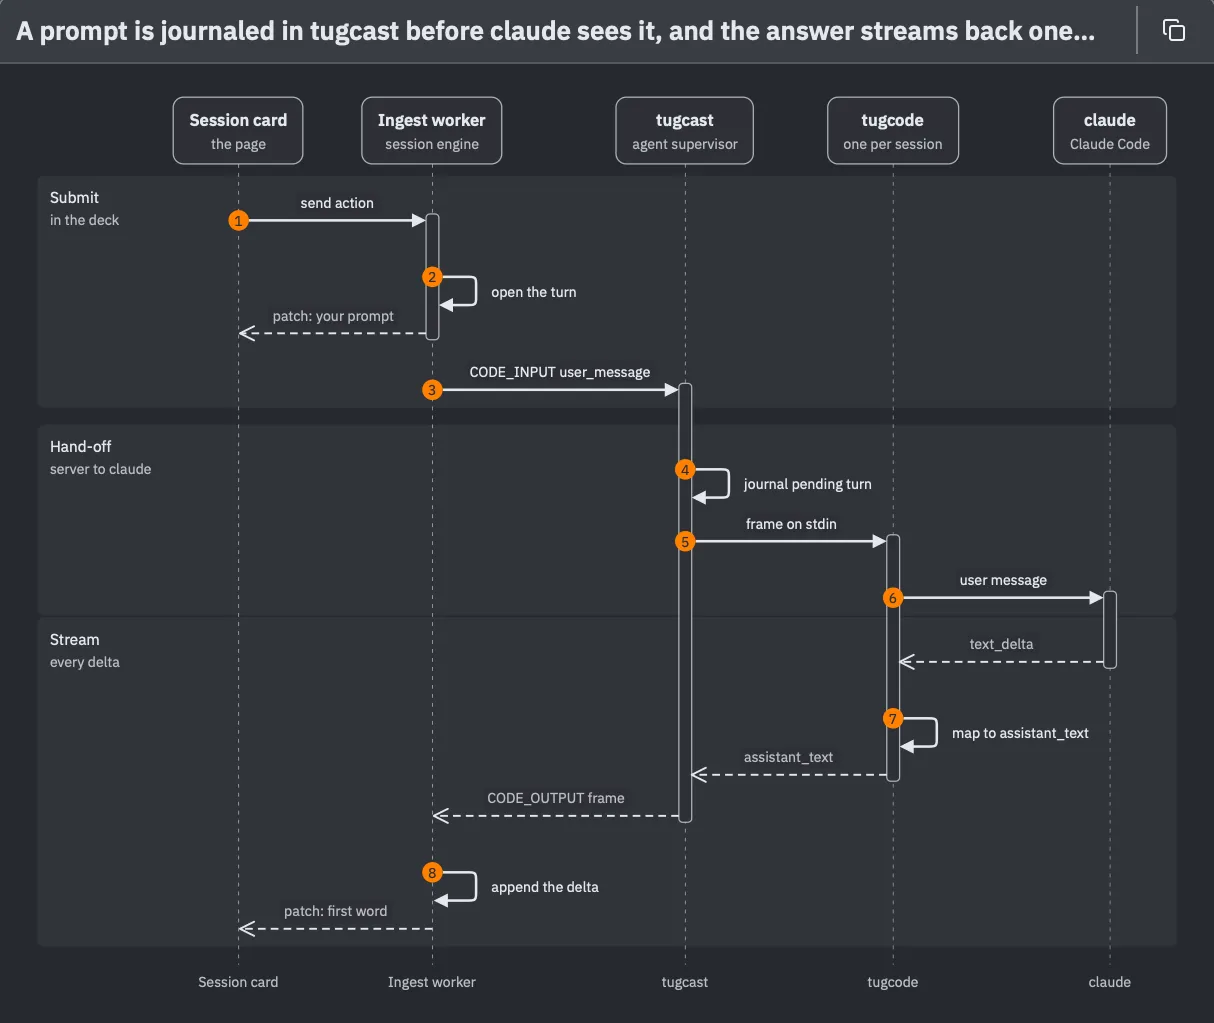
This is the sequence form. The parties are across the top and time runs down. The figure is cut into three bands. In Submit, my prompt goes from the Session card to a background worker (1, 2) and on to tugcast (3). In Hand-off, tugcast passes it to tugcode (4, 5), and tugcode passes it to Claude Code (6). In Stream, the answer comes back the other way, one small piece at a time (7, 8), until the first word lands in the transcript.
The text under this figure pointed out two important things. My prompt shows up in the transcript right away, before it has even left the page, which is why pressing Return feels snappy. And tugcast writes the prompt down (4) before handing it on. If anything crashes after that, the turn can be recovered.
What does an answer pass through?
The same trip in the other direction, as strata: the layers an answer passes through on its way from Claude Code to the transcript.
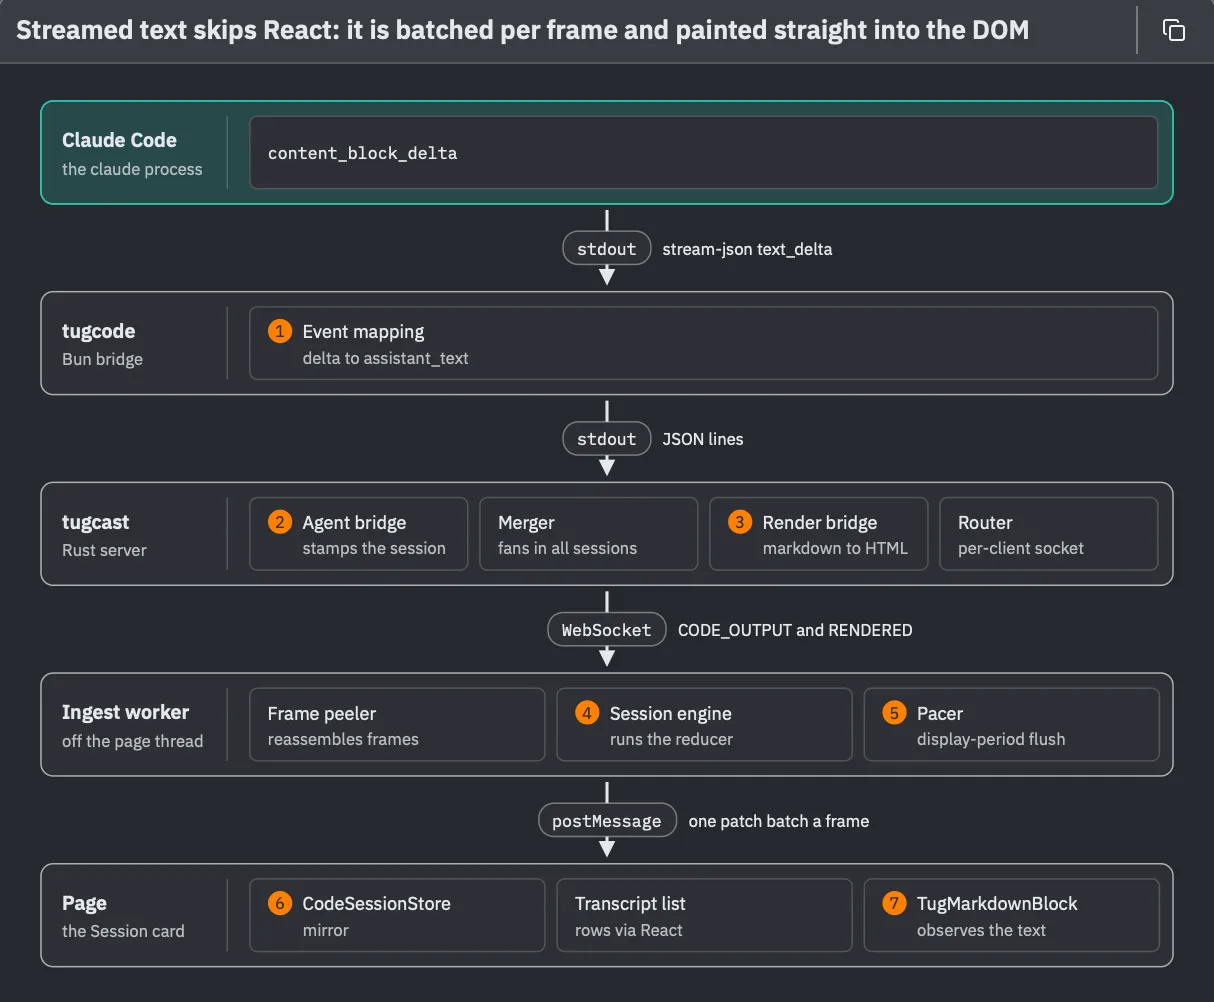
This is the layers form, and the labels between the bands are the point of it. Each one names the channel and the way the answer is formed as it crosses: events on standard output from Claude Code, Tug’s own messages out of tugcode (1), frames on a WebSocket out of tugcast (2, 3), and batches of changes from a background worker (4, 5) to the page (6, 7).
The title communicates the finding again. Every layer above the worker passes each piece of the answer straight through. The worker is the first place anything waits: it hands the page at most one batch of changes per screen refresh. And on the page, the streaming text skips React altogether and is written straight into the page’s DOM. That’s how a fast answer can stream in without the card stuttering.
How does a chart get into the card?
Now for Tug’s charts: how a chart gets from tugtool chart commits into the Session card.
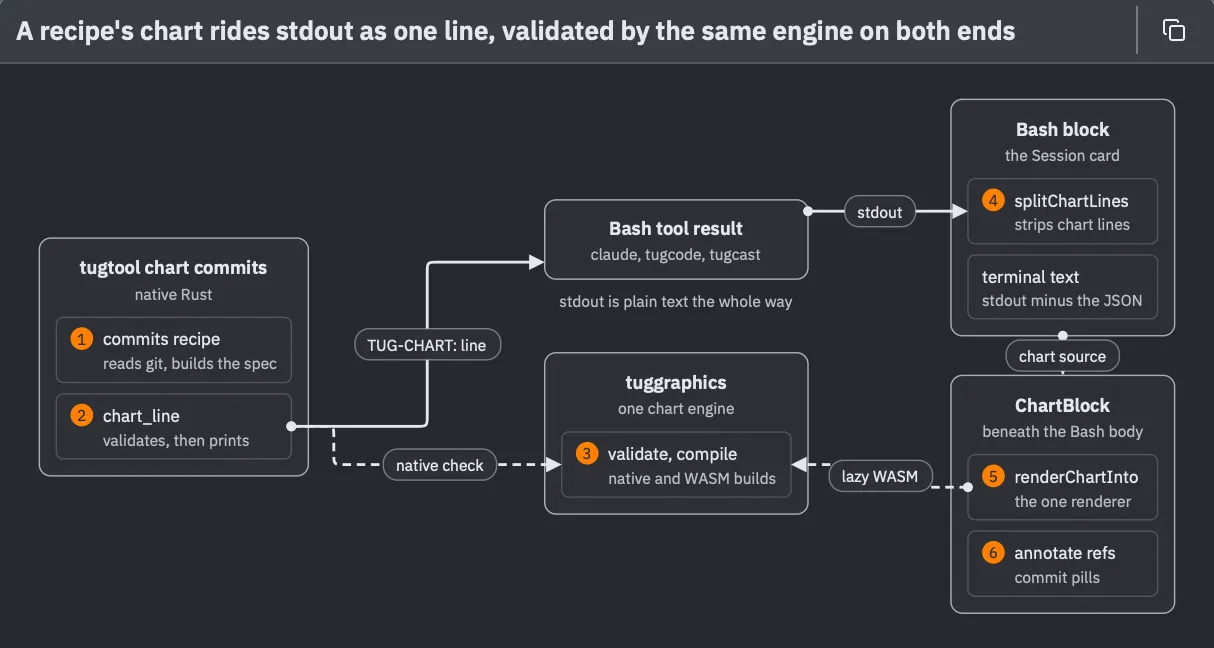
This is the flow form, for work that moves through parts and branches along the way. The answer is simple: a chart has no special channel. The command builds the chart’s description (1), checks it, and prints it as one line of ordinary output (2). That line moves along with everything else the command printed, and only the Session card knows to look for it and pull it out (4). Then the card draws it (5) and links the commits the chart names (6).
The clever bit is the box in the middle. The same chart engine (3) runs at both ends: built into the command, where it checks the description before printing it, and loaded into the page, where it draws it. So the card is never handed a chart it can’t draw.
What is a prompt doing right now?
Last question: the states a prompt goes through in the Session card, from idle to a finished answer, and what moves it from one state to the next. As a states diagram.
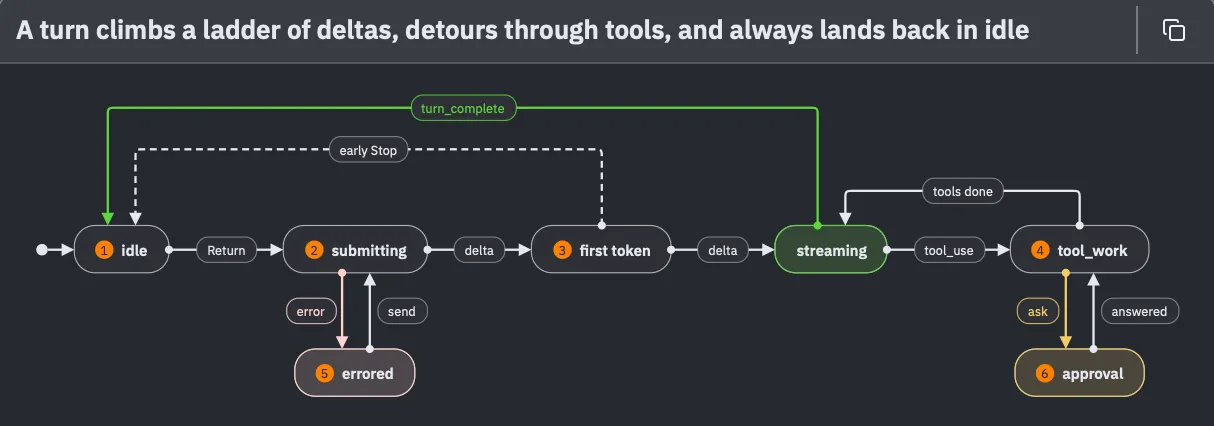
This is the states form, for one aspect that changes over time. A normal turn reads left to right along the main line: I press Return, the first piece of the answer arrives, the rest streams in, and the AI may detour into tool work and come back. The two arrows over the top both lead home to idle. The side trips hang underneath: a failure (5), and a question or permission dialog that parks the turn until I answer it (6).
There is no “finished” state. When a turn completes, it’s recorded in the transcript and the prompt goes straight back to idle, and whether it succeeded or was stopped is written on the turn, not kept in the state.
Six forms, and a few rules
Those six figures cover all six forms a diagram can take:
- Stack, for architecture: the big blocks and how they’re arranged.
- Tree, for what is inside what.
- Sequence, for messages between a few parties, in order.
- Layers, for the strata something passes through, and what crosses each boundary.
- Flow, for work moving through parts, with branches.
- States, for what a thing can be, and what moves it from one state to the next.
Note that I picked the form for only two of them. The AI chose the other four from the question.
There’s no special syntax for picking which diagram form. I just say which form I want as part of the request, in plain words, the way I did with as a tree and as a states diagram. It works for any subject: explain how saving a file works, as a sequence diagram, or show the same thing as layers. Asking for a second form is a good idea when the first figure answers a slightly different question than the one I had in mind.
And I don’t have to remember the six names. Tug has a sheet for that, called Explain Code. I open it with Control-Command-X, or from the Session menu, or by typing /explain-code.
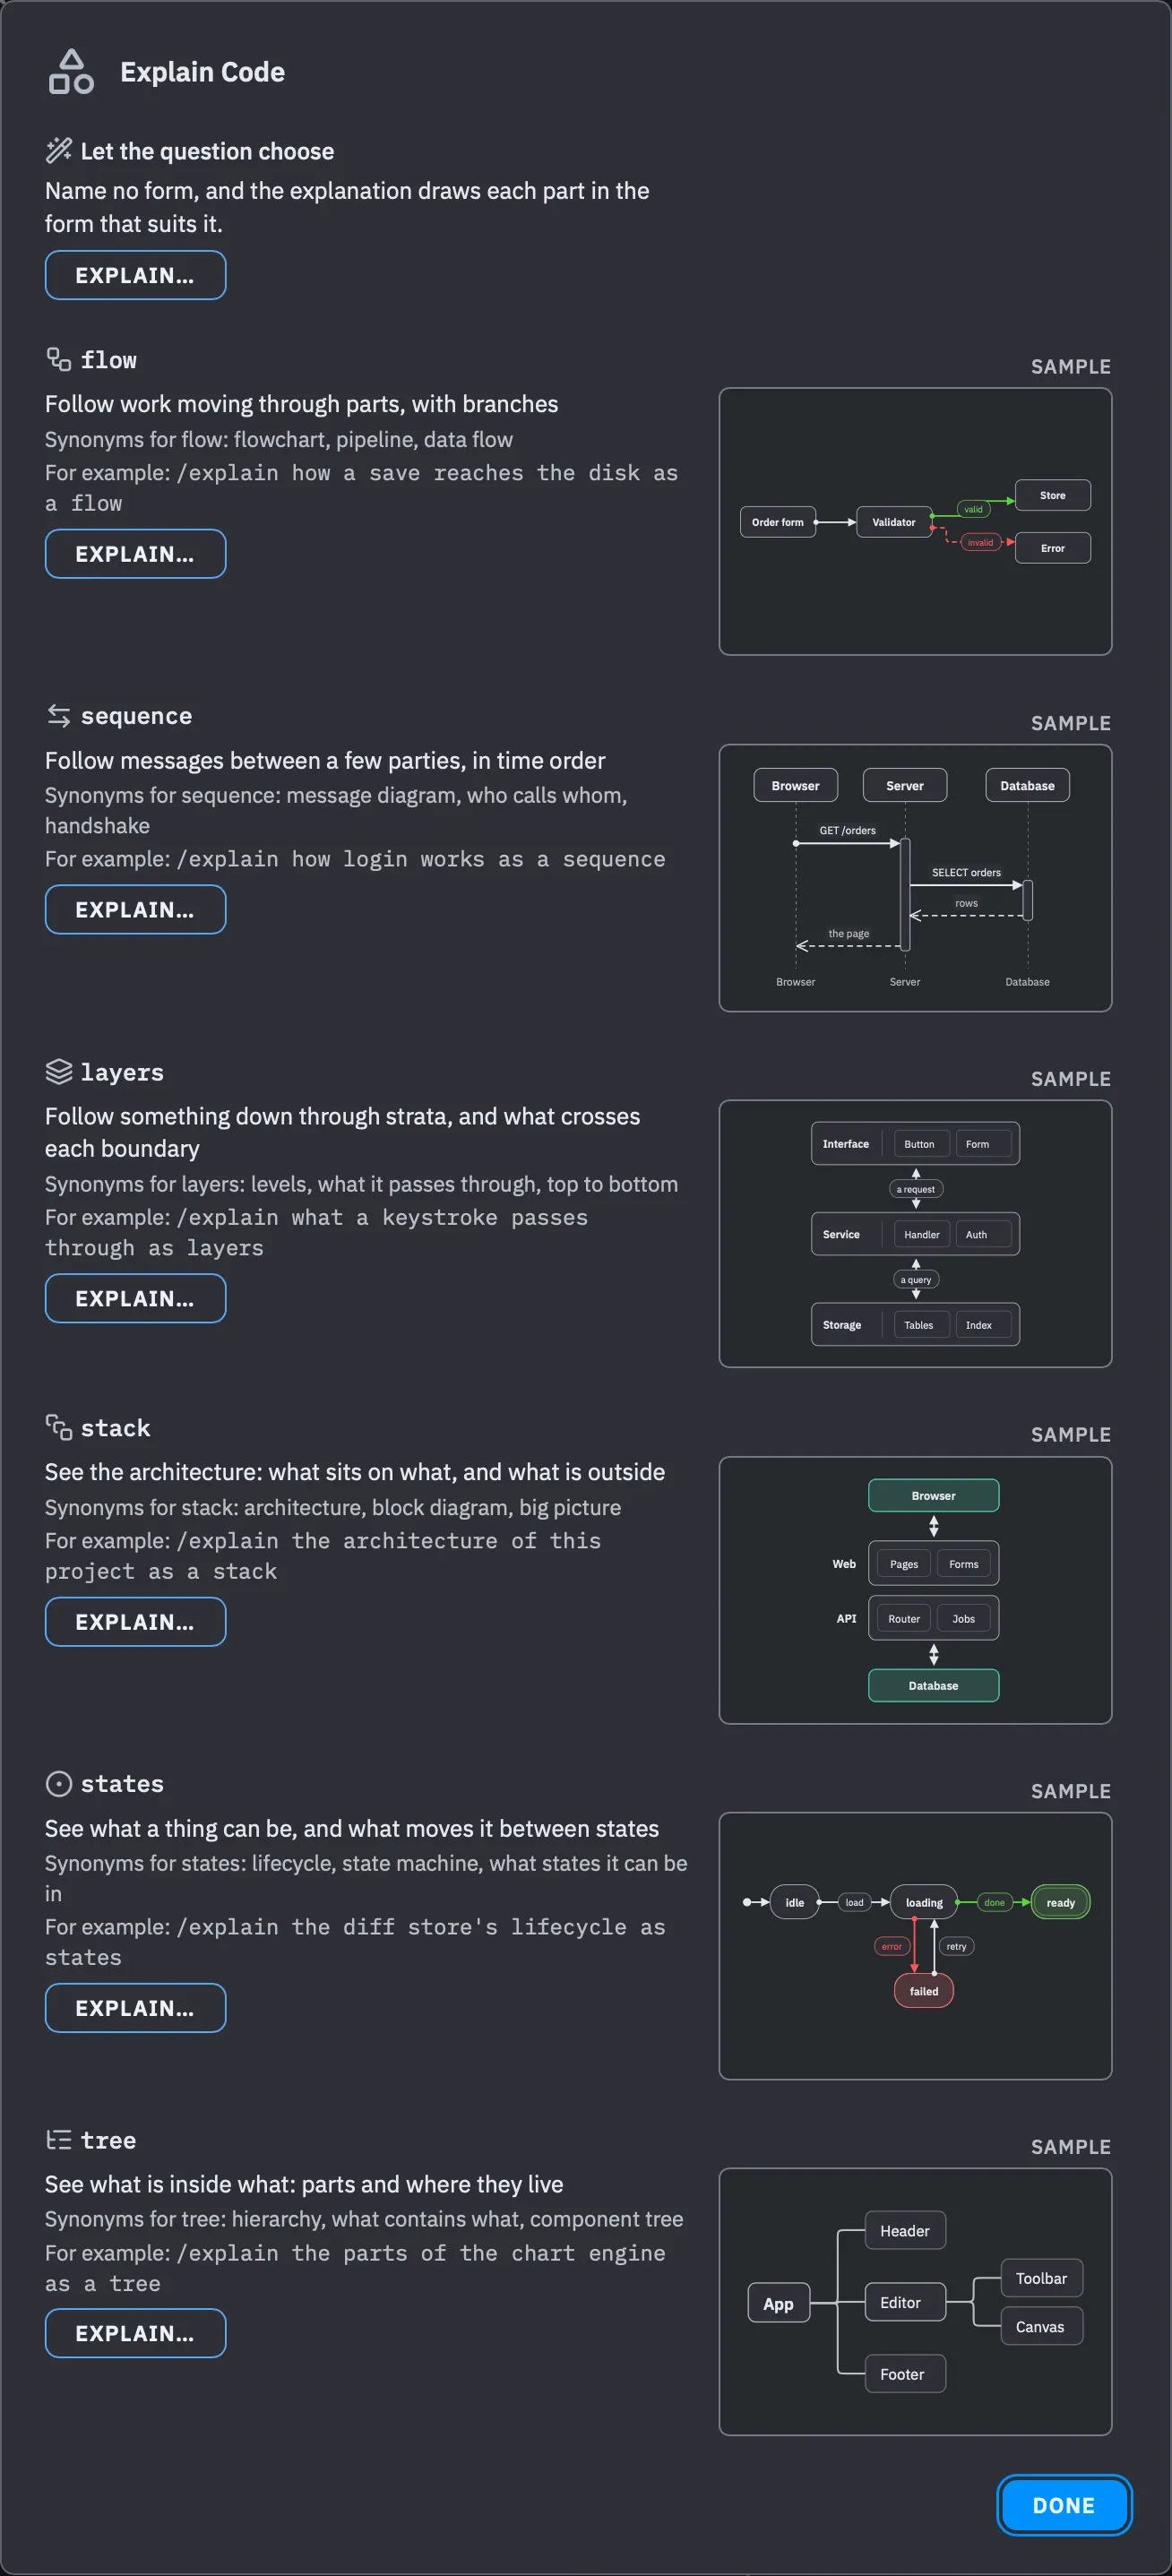
I love this sheet… just as much as the one for visualizing data! ❤️
Each explainer gets a row saying what it does, the everyday words that ask for it (“flowchart” gets a flow, “who calls whom” gets a sequence), an example request, and a small sample figure. Clicking Explain… puts the command in the prompt with the proper request form already written, and puts the caret at the end where you can type additional details (like the subject). I type what I want explained and press Return. The first row, Let the question choose, names no form at all and leaves the choice to the AI.
The AI doesn’t draw these diagrams. As with charts, the model writes a small description: the names, what connects to what, and the order. It never gives a position for anything. Tug does the layout, measures the text, and colors the result from my theme. (There’s a custom graphics language built into Tug to support this, but that’s a story for another day. 🖍️) Color is kept minimal—accents are used sparingly—and a line turns green or red only to mean something, like the path that succeeds or the one that fails.
Every diagram image in this post was made with Share Turns, which I covered in A Whirlwind First Week. Each one is created from a prompt and its answer, rendered by Tug just as it looks in the session card. The file card and the sheet are plain screenshots of the app.
Who this is for
These Tug diagrams aren’t really for me… although I find them very interesting indeed! They’re for the person who doesn’t know yet: someone looking at Tug for the first time, the casual cloner of this project (or any project) for the first time. Someone wondering where to start. Since Tug is open source, this could be you! 👋
Over the past couple of weeks people have begun reading its code, filing bugs, and sending changes. Every one of them had to build a picture of the app in their head before they could do anything useful. A wall of prose is a slow way to get that picture. A diagram with a numbered guide into the code is a faster way.
And nothing here is special to Tug. /explain reads whatever project the session is open on, so the same six questions work on any codebase: one you just joined, one you inherited, or one you’re just curious about. Give it a try!