

Ask for a Chart, Get a Chart
Updated November 17, 2026: there’s now a sheet that shows every chart, and charts you can click to see the underlying data. 🤓
Tug can draw charts. In the flow of a session or conversation with the AI, I type a question or request, and the answer comes back with a figure in the transcript, drawn in my current theme, sitting right under the command that produced the numbers.
The best way to show this is to use it. I opened a session on the Tug project itself and asked six questions about the last month of work, one after another, the way I’d ask a colleague. Here’s the whole conversation.
How busy have I been?
I started with a simple request about work throughput: chart the recent commit rate.
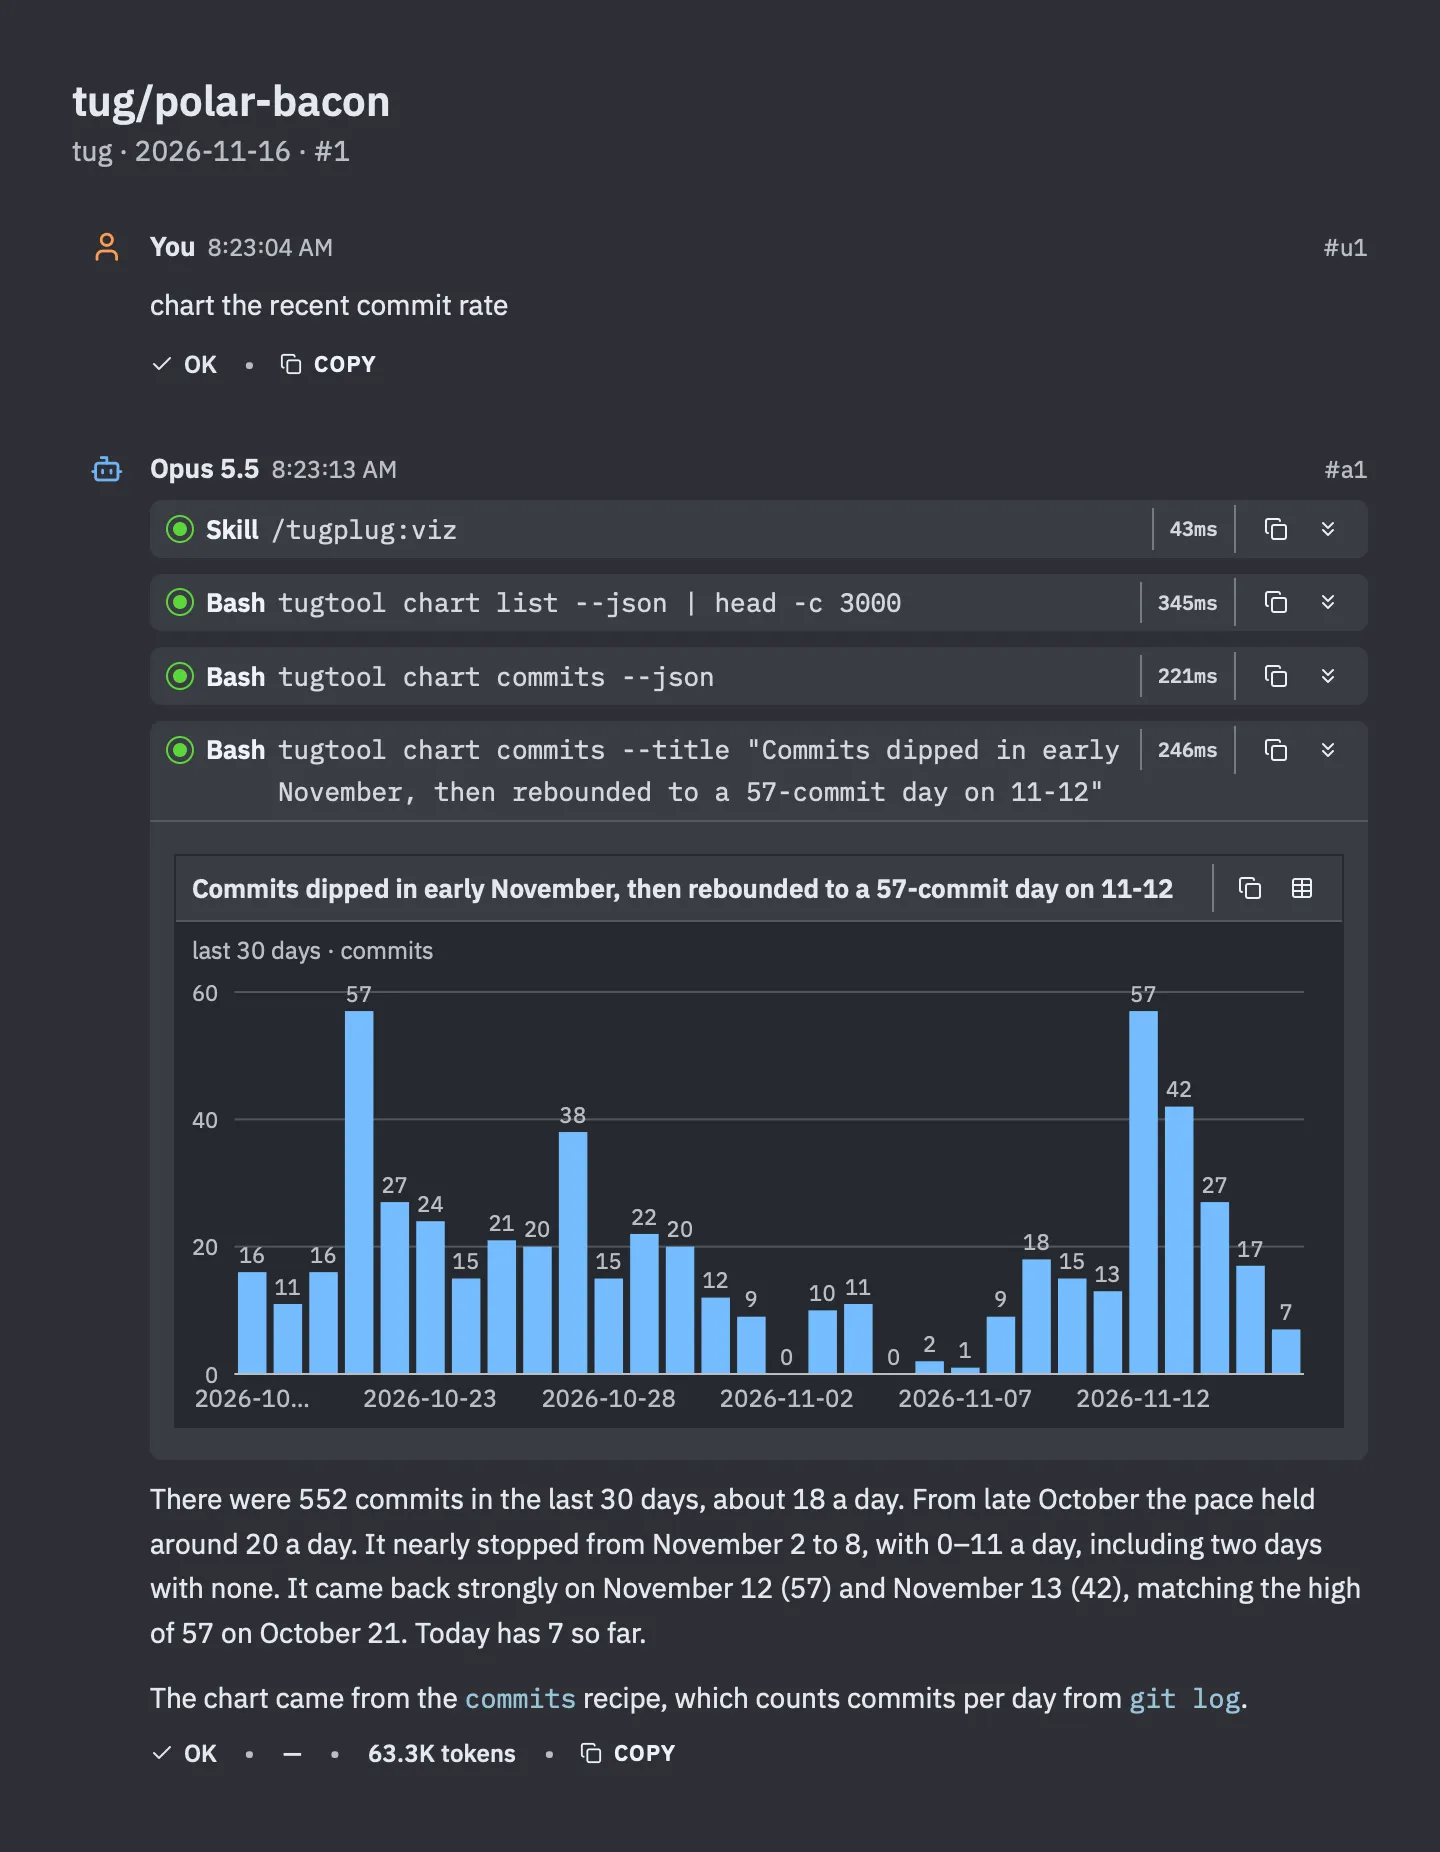
552 commits in 30 days, about 18 a day. And there it is, plain as anything: work nearly stopped from November 2 to 8, including two days with no commits at all, and then came roaring back with 57 commits on November 12.
I know what that gap is. I spent that week on my home office and my video recording setup, getting ready to make the videos I’ve been posting since. The chart doesn’t know that, but it found the week.
Notice the title on the chart. It isn’t “Commits per day.” It’s the finding: Commits dipped in early November, then rebounded to a 57-commit day on 11-12. The AI reads the numbers first, then titles the chart with what they say.
What kind of work was it?
A follow-up question, in the same session: Back to the commits, what kind of work was it?
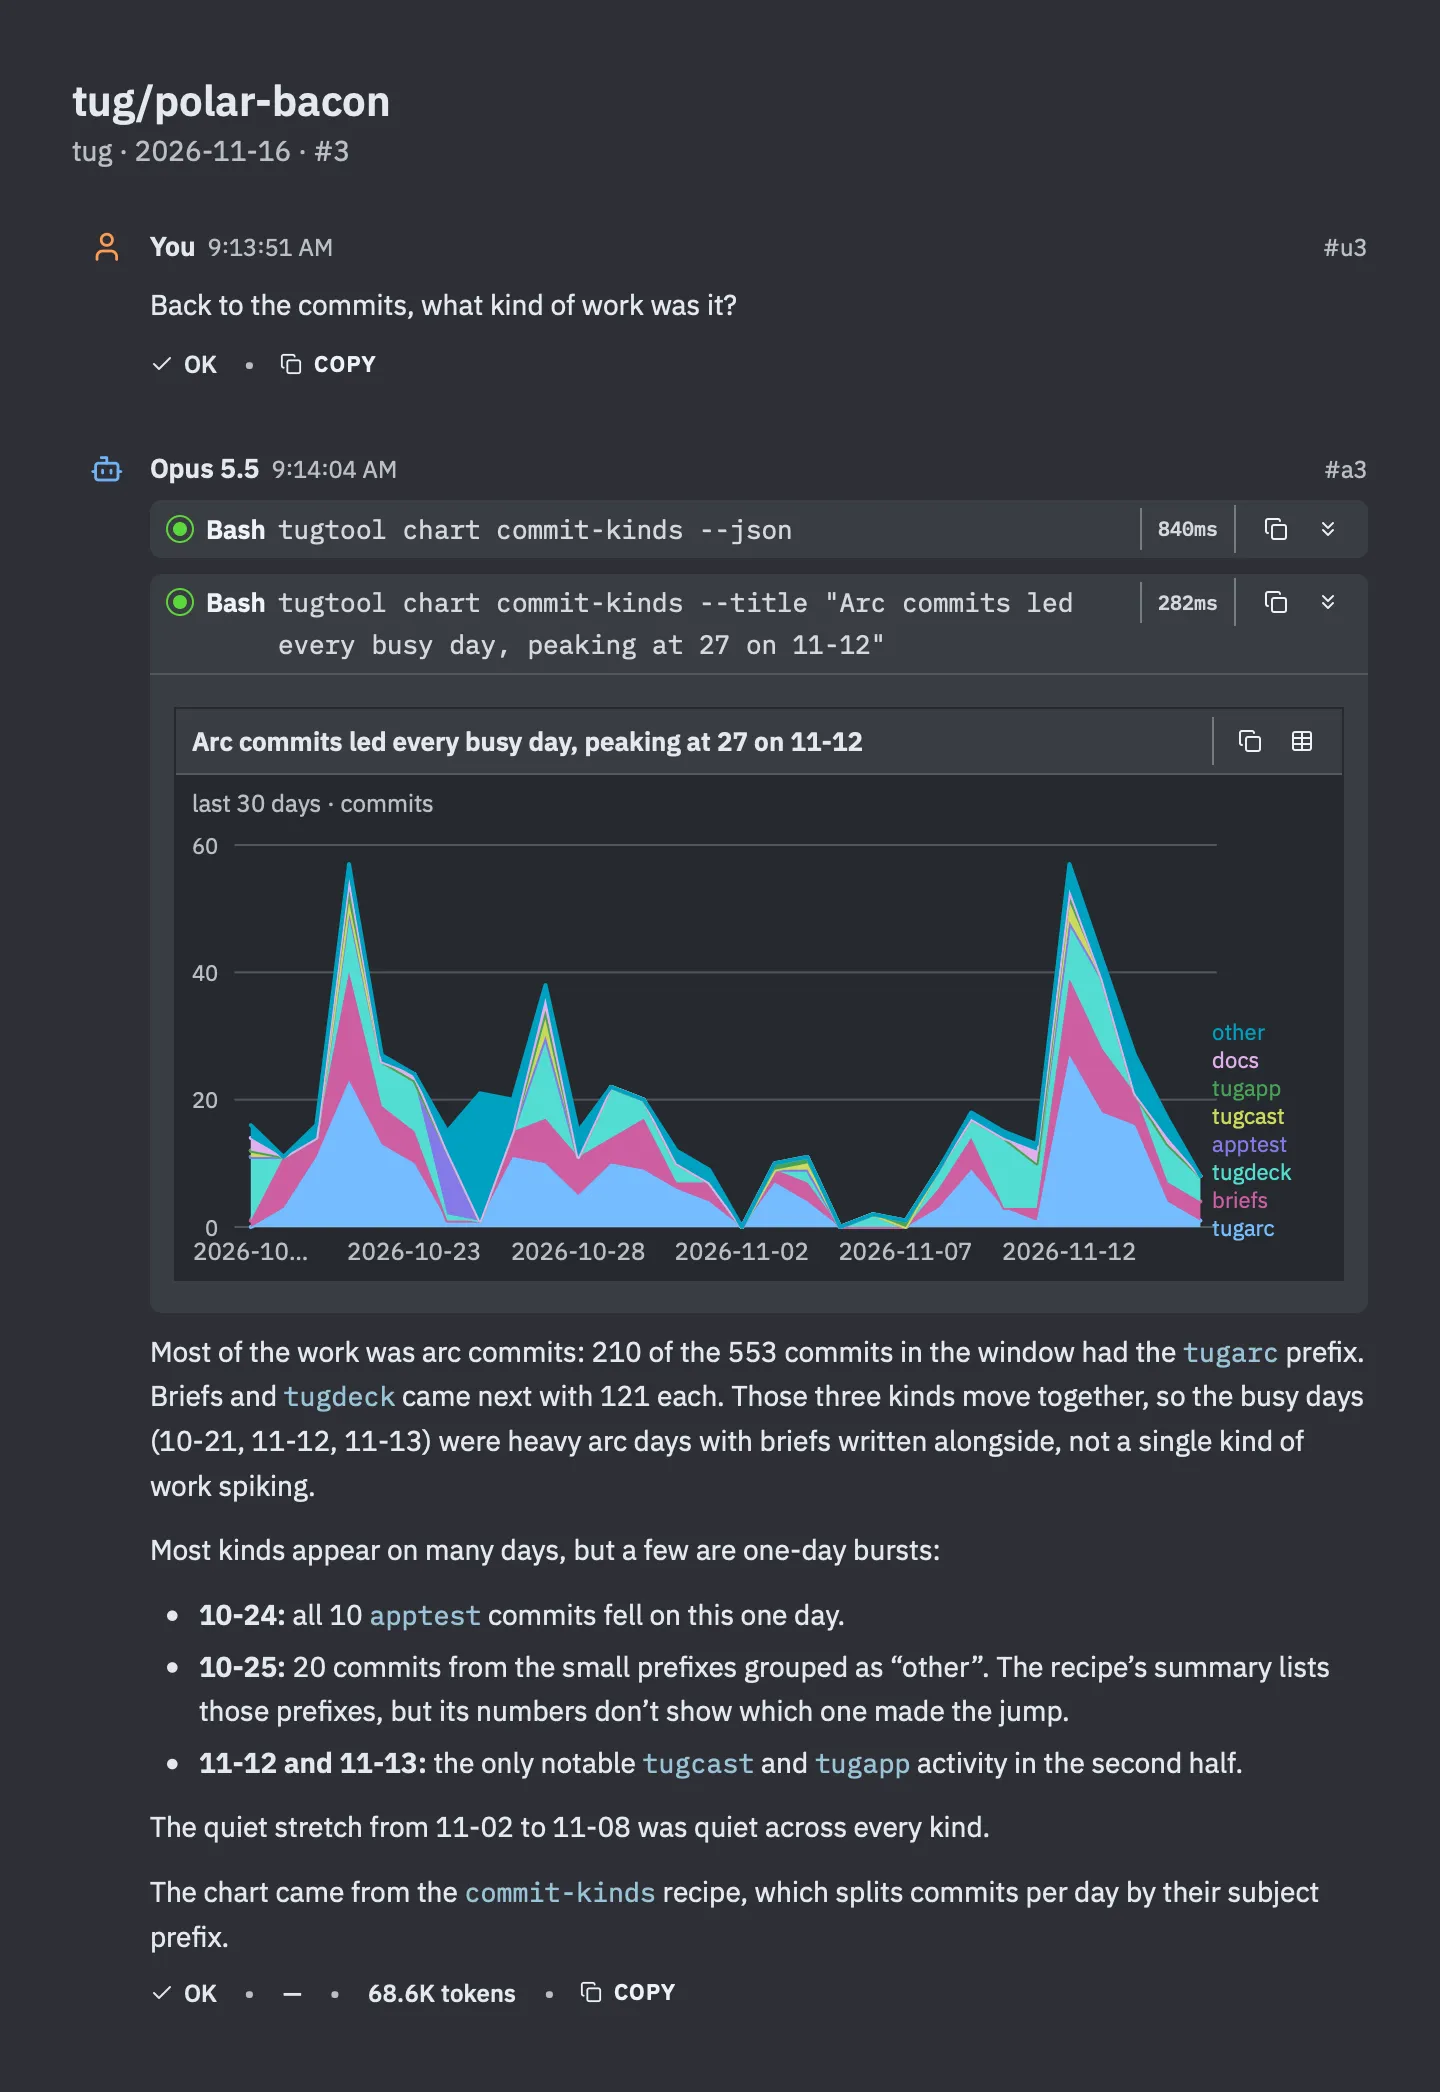
Every commit in Tug starts with a prefix that says what part of the project it touches. This chart splits each day by that prefix. Arc commits lead, with 210 of them, and briefs and the front end follow at 121 each. Those three rise and fall together, which matches how I work: write a brief, run an arc, land the result.
The quiet week is quiet in every color.
How many arcs?
An arc is Tug’s unit of planned work. It runs in its own git worktree, step by step, and joins back onto the main branch when it’s done. So I asked: How many arcs have run lately?
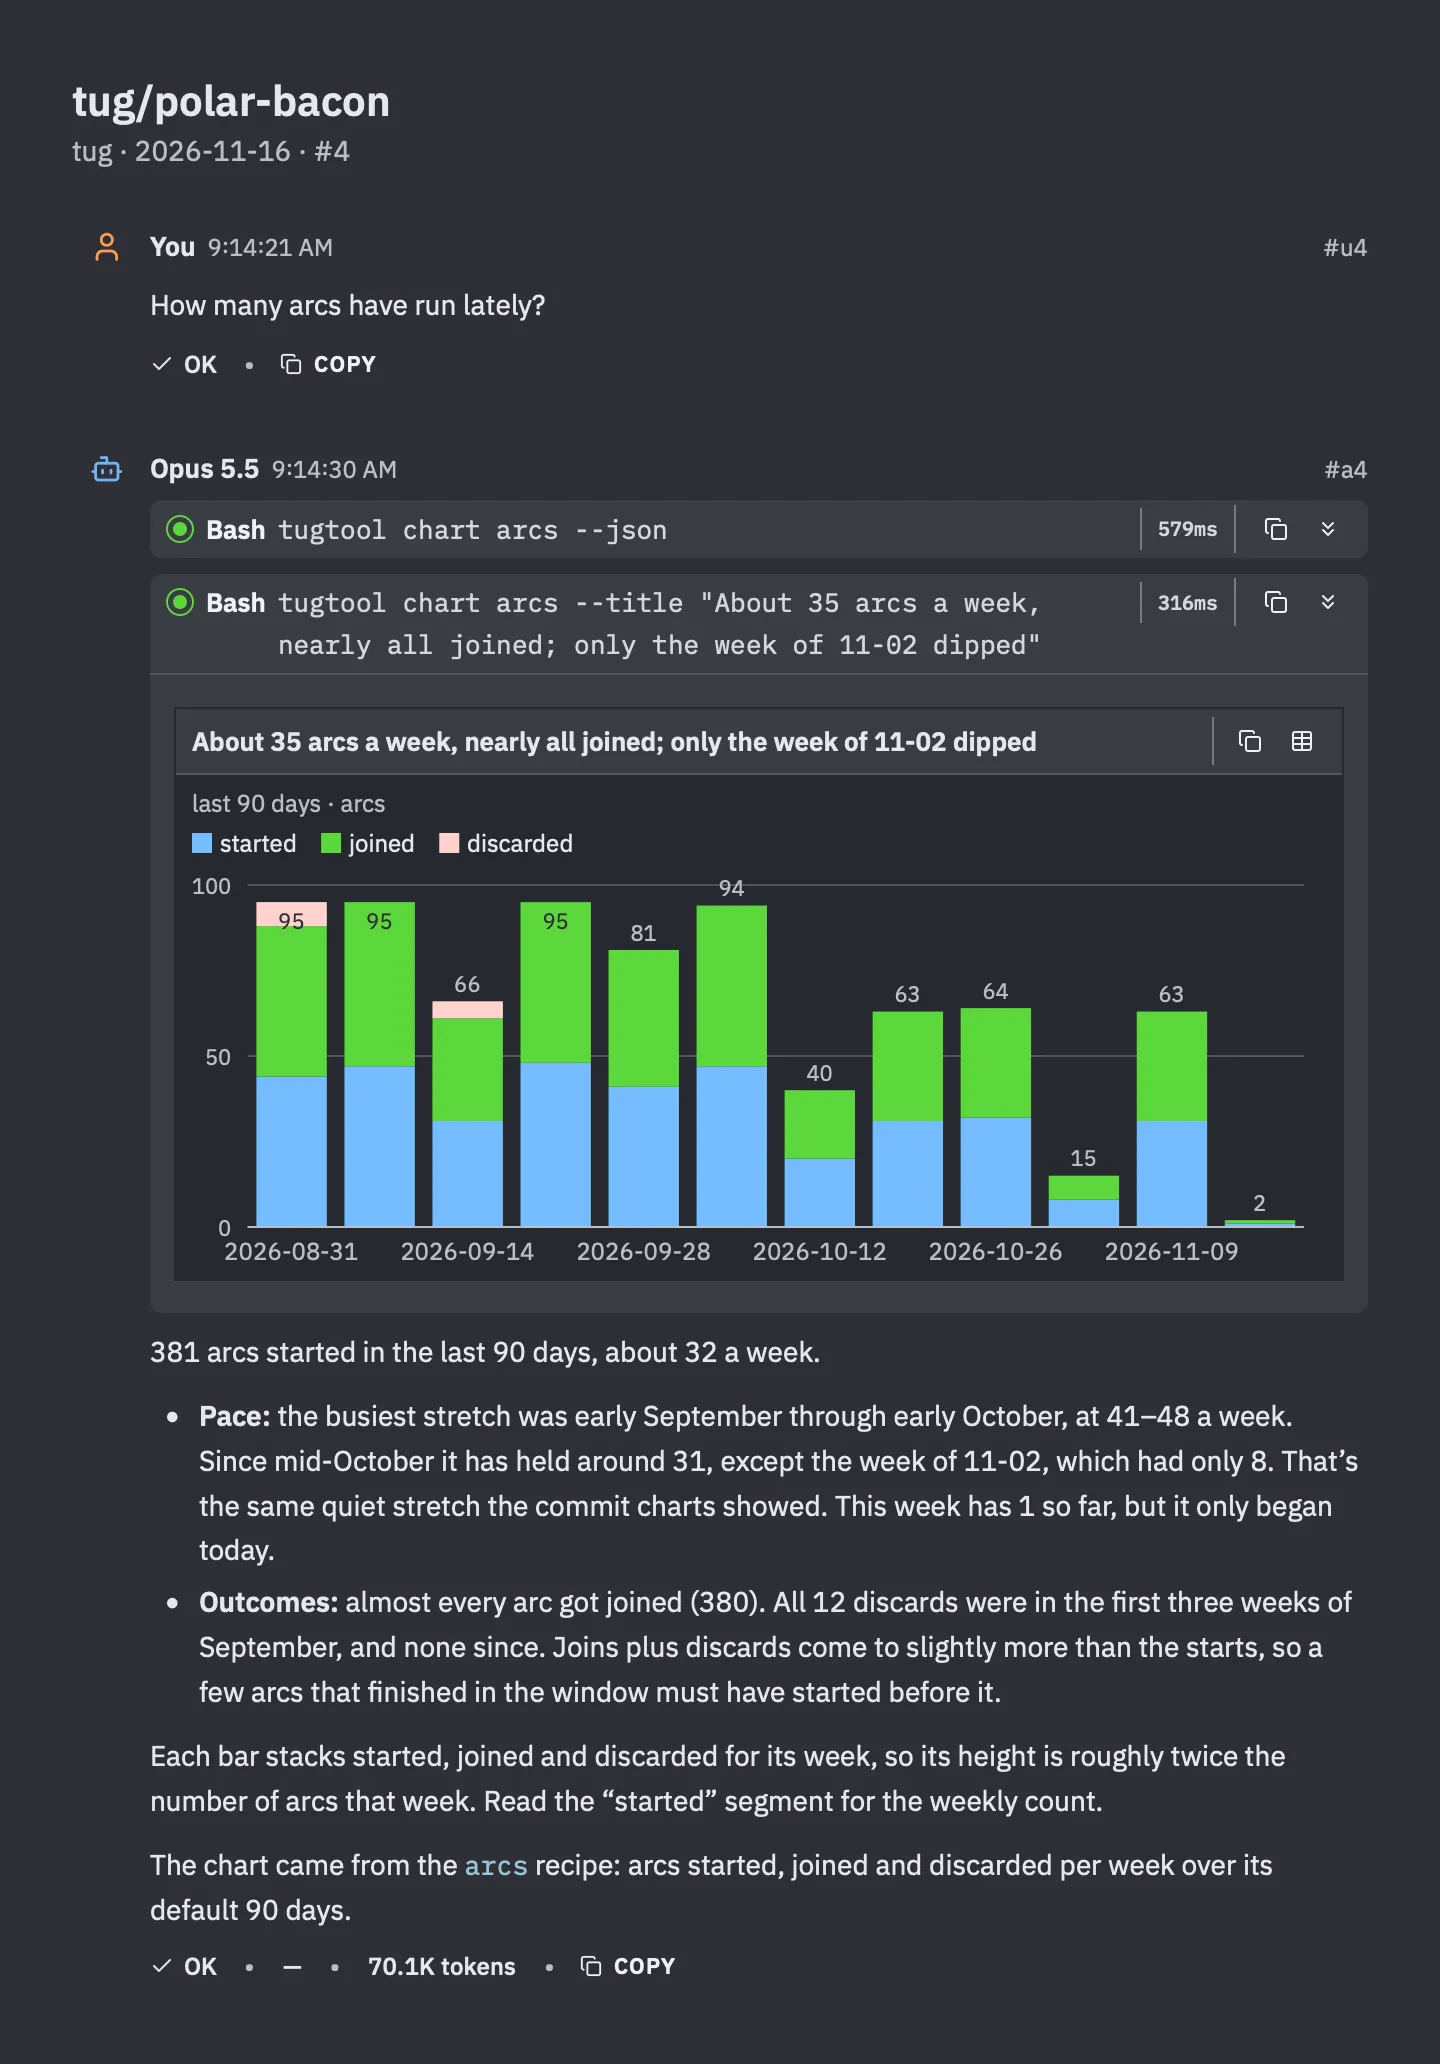
381 arcs started in 90 days, about 32 a week, and 380 joined. The same quiet week shows up here too, with 8 arcs where there would usually be 30 or more. The 12 discarded arcs all date from the first three weeks of September. I haven’t thrown one away since.
(Aside: I find this an impressive number! I had no idea that I had run so many arcs. They really work! Super-useful feature in Tug.)
Where does one arc’s time go?
Now I wanted to look inside one. I picked the arc that built Tug’s diagrams (which have a post of their own, Don’t Tell Me, Show Me: Diagrams That Explain Code) and asked: Where did the code-explainers arc’s time go?
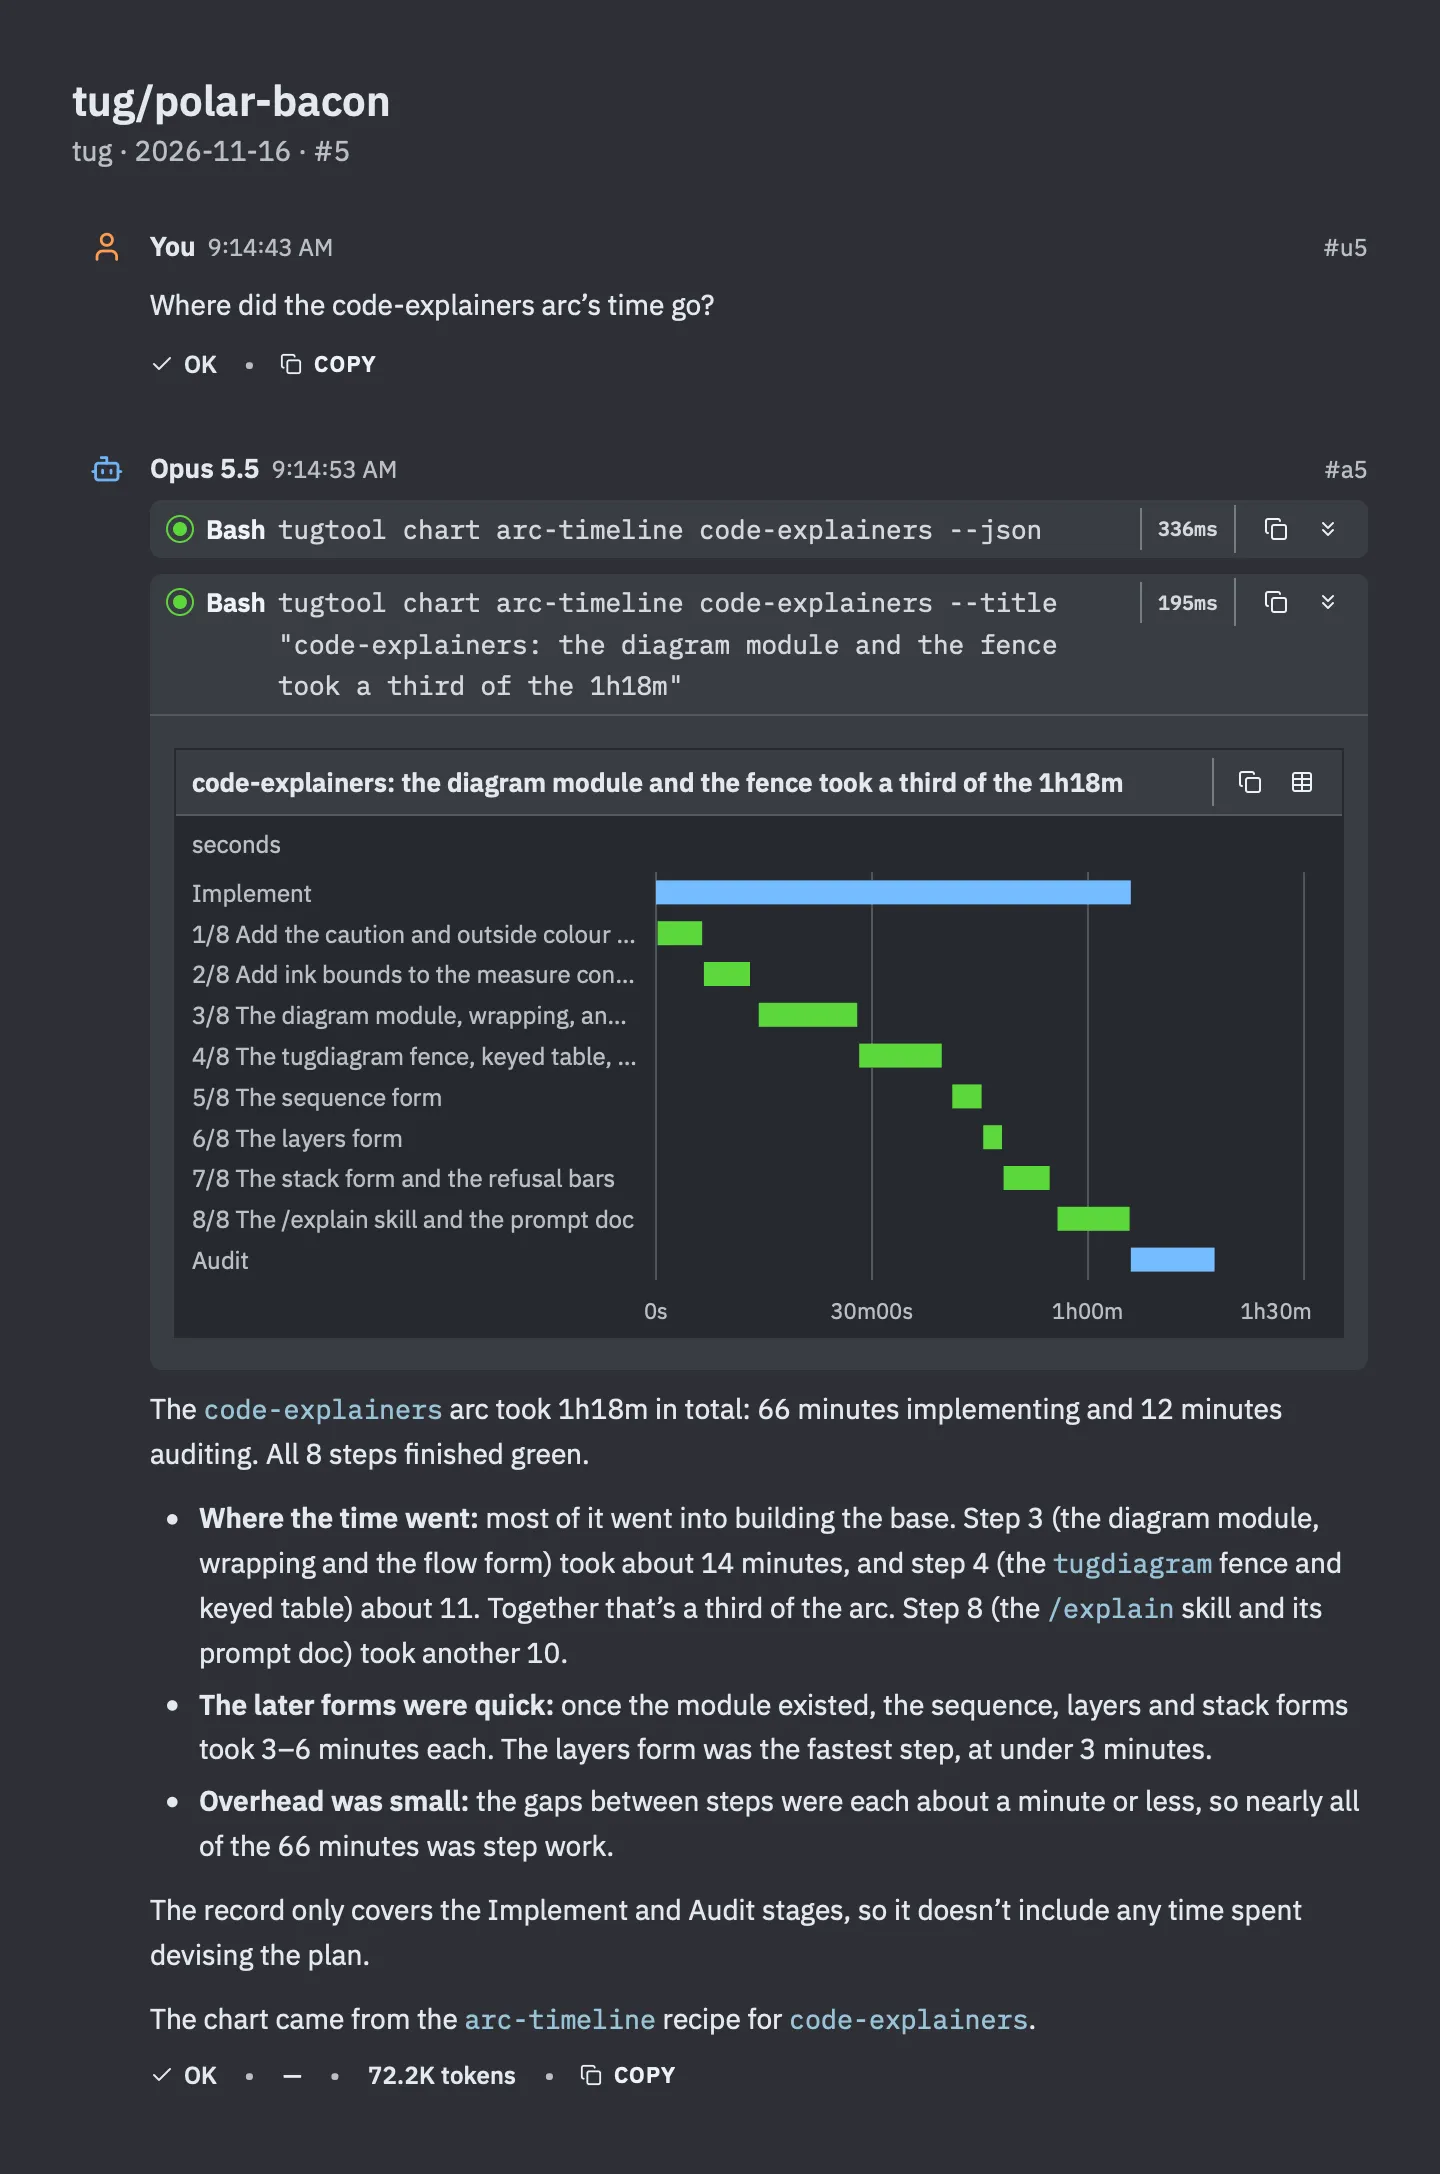
An hour and eighteen minutes, start to finish: 66 minutes implementing and 12 auditing. The staircase is the eight steps. The long treads near the top are the foundation, the diagram module and the fence that draws it. Once those existed, each new diagram form took three to six minutes.
The chart only covers the building and the checking, not the time I spent planning beforehand. Still, that’s a whole feature in less time than a long lunch.
What’s been red?
Charts aren’t only for good news. What has been red in the tests?
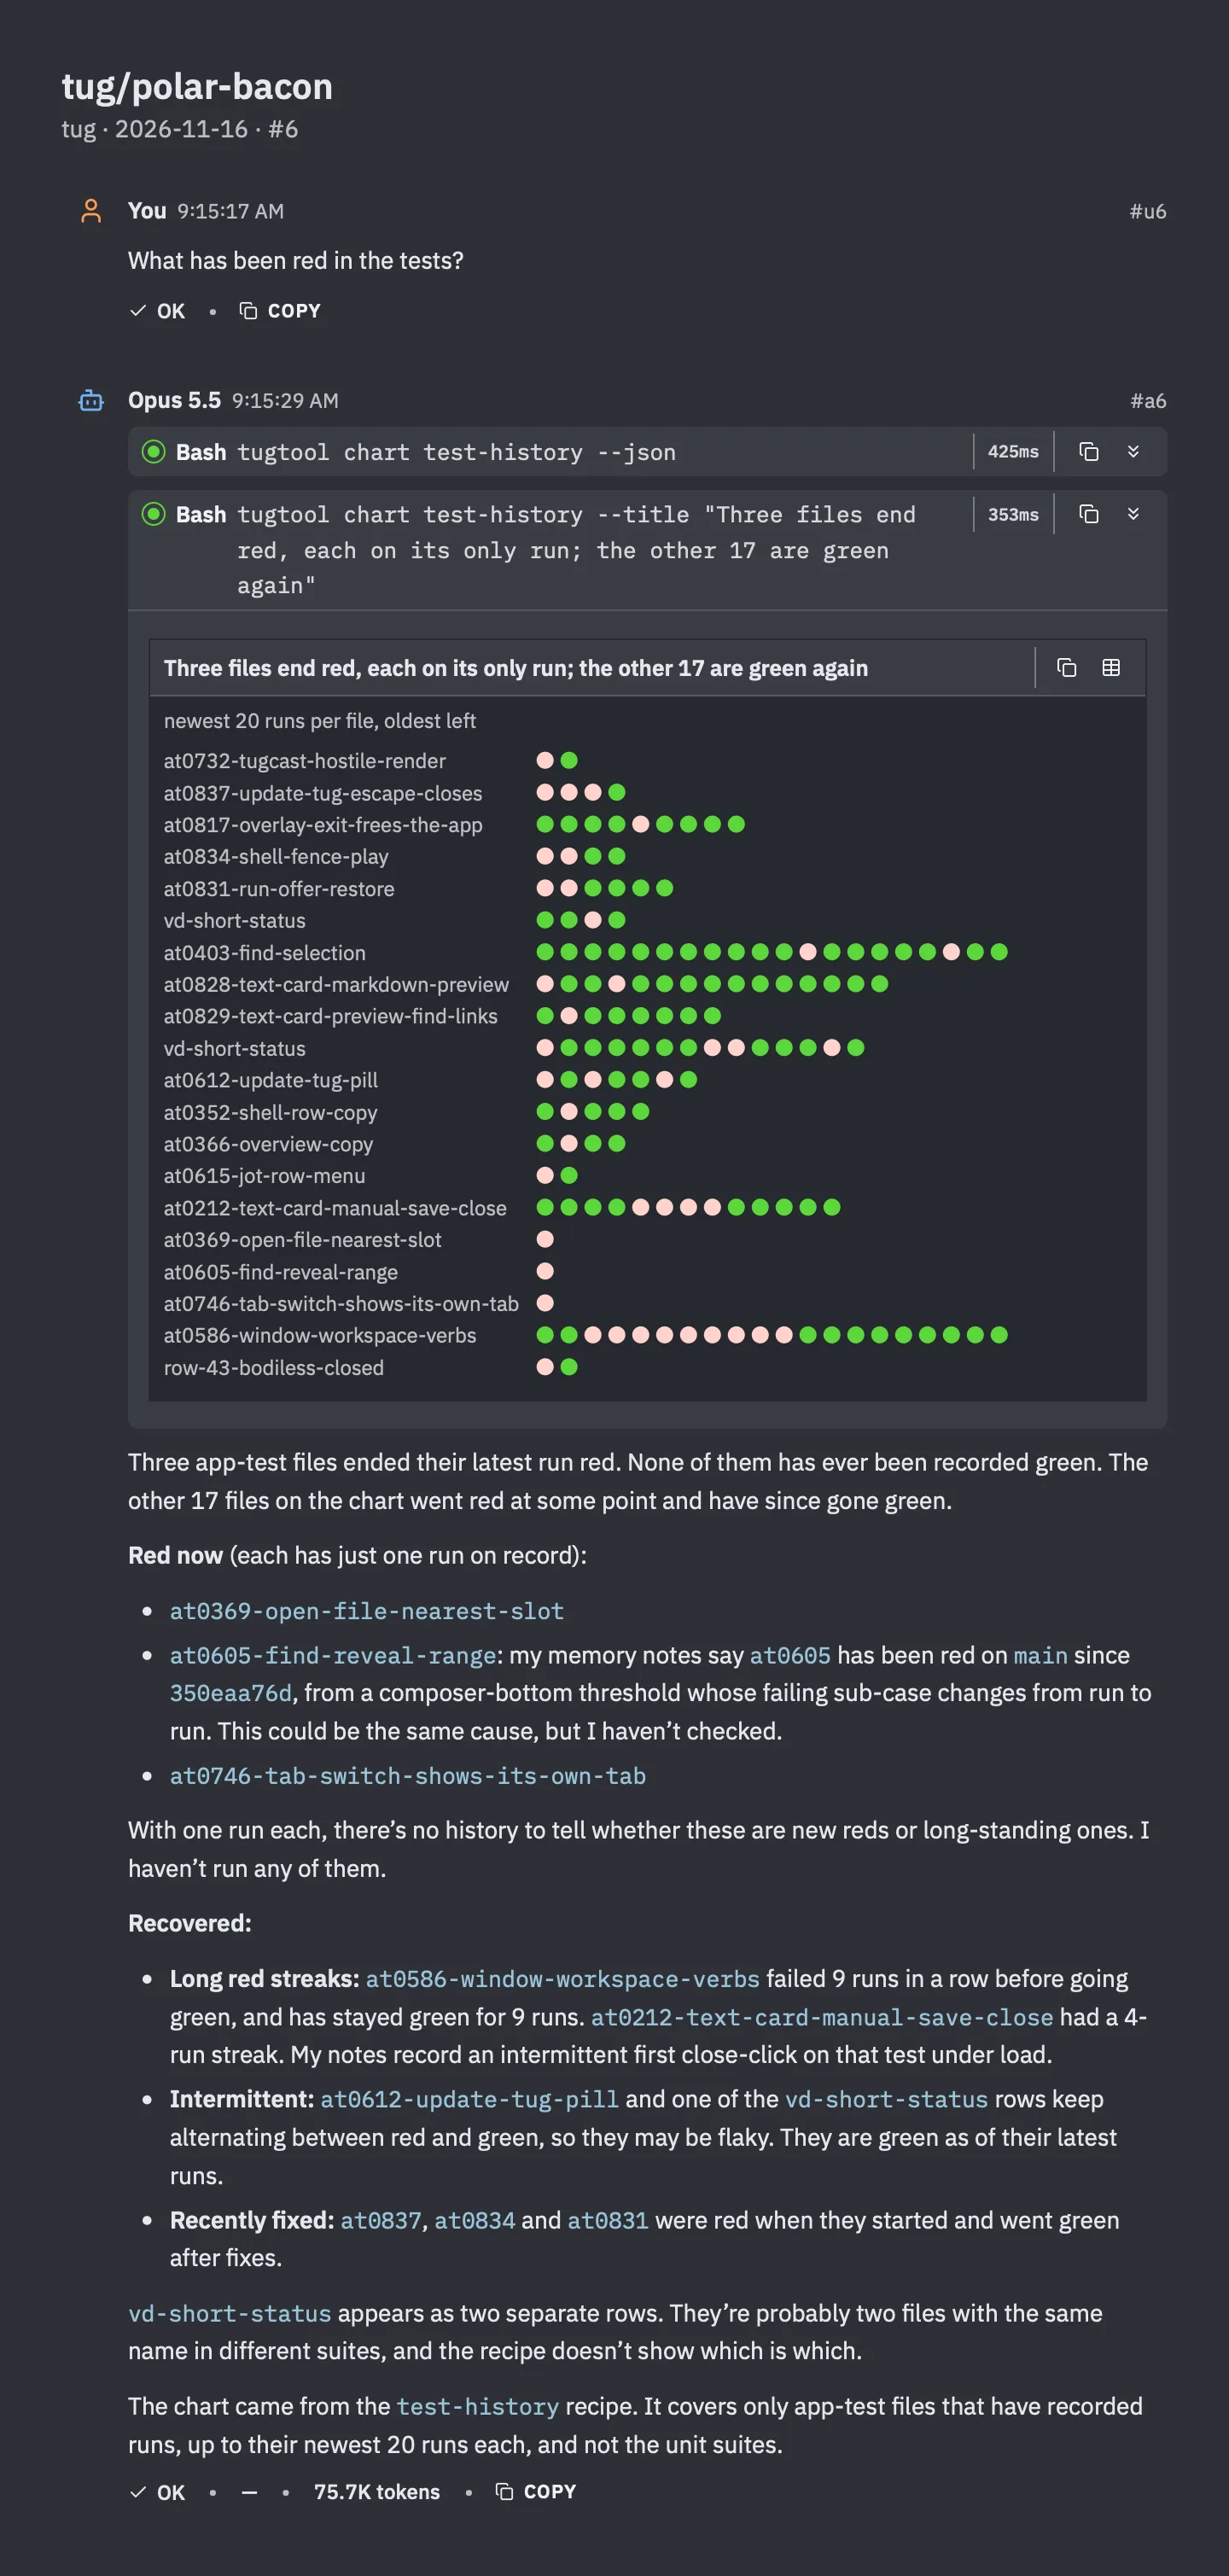
Each row is a test file, and each dot is one run, oldest on the left. I can see at a glance which tests failed once and got fixed, which one failed nine runs in a row before I finally sorted it out, and which ones flicker back and forth and deserve some suspicion.
The answer under the chart does the reading for me. Three files are red right now, and it names them.
When does the work land?
One last question, a personal one: When does work land?
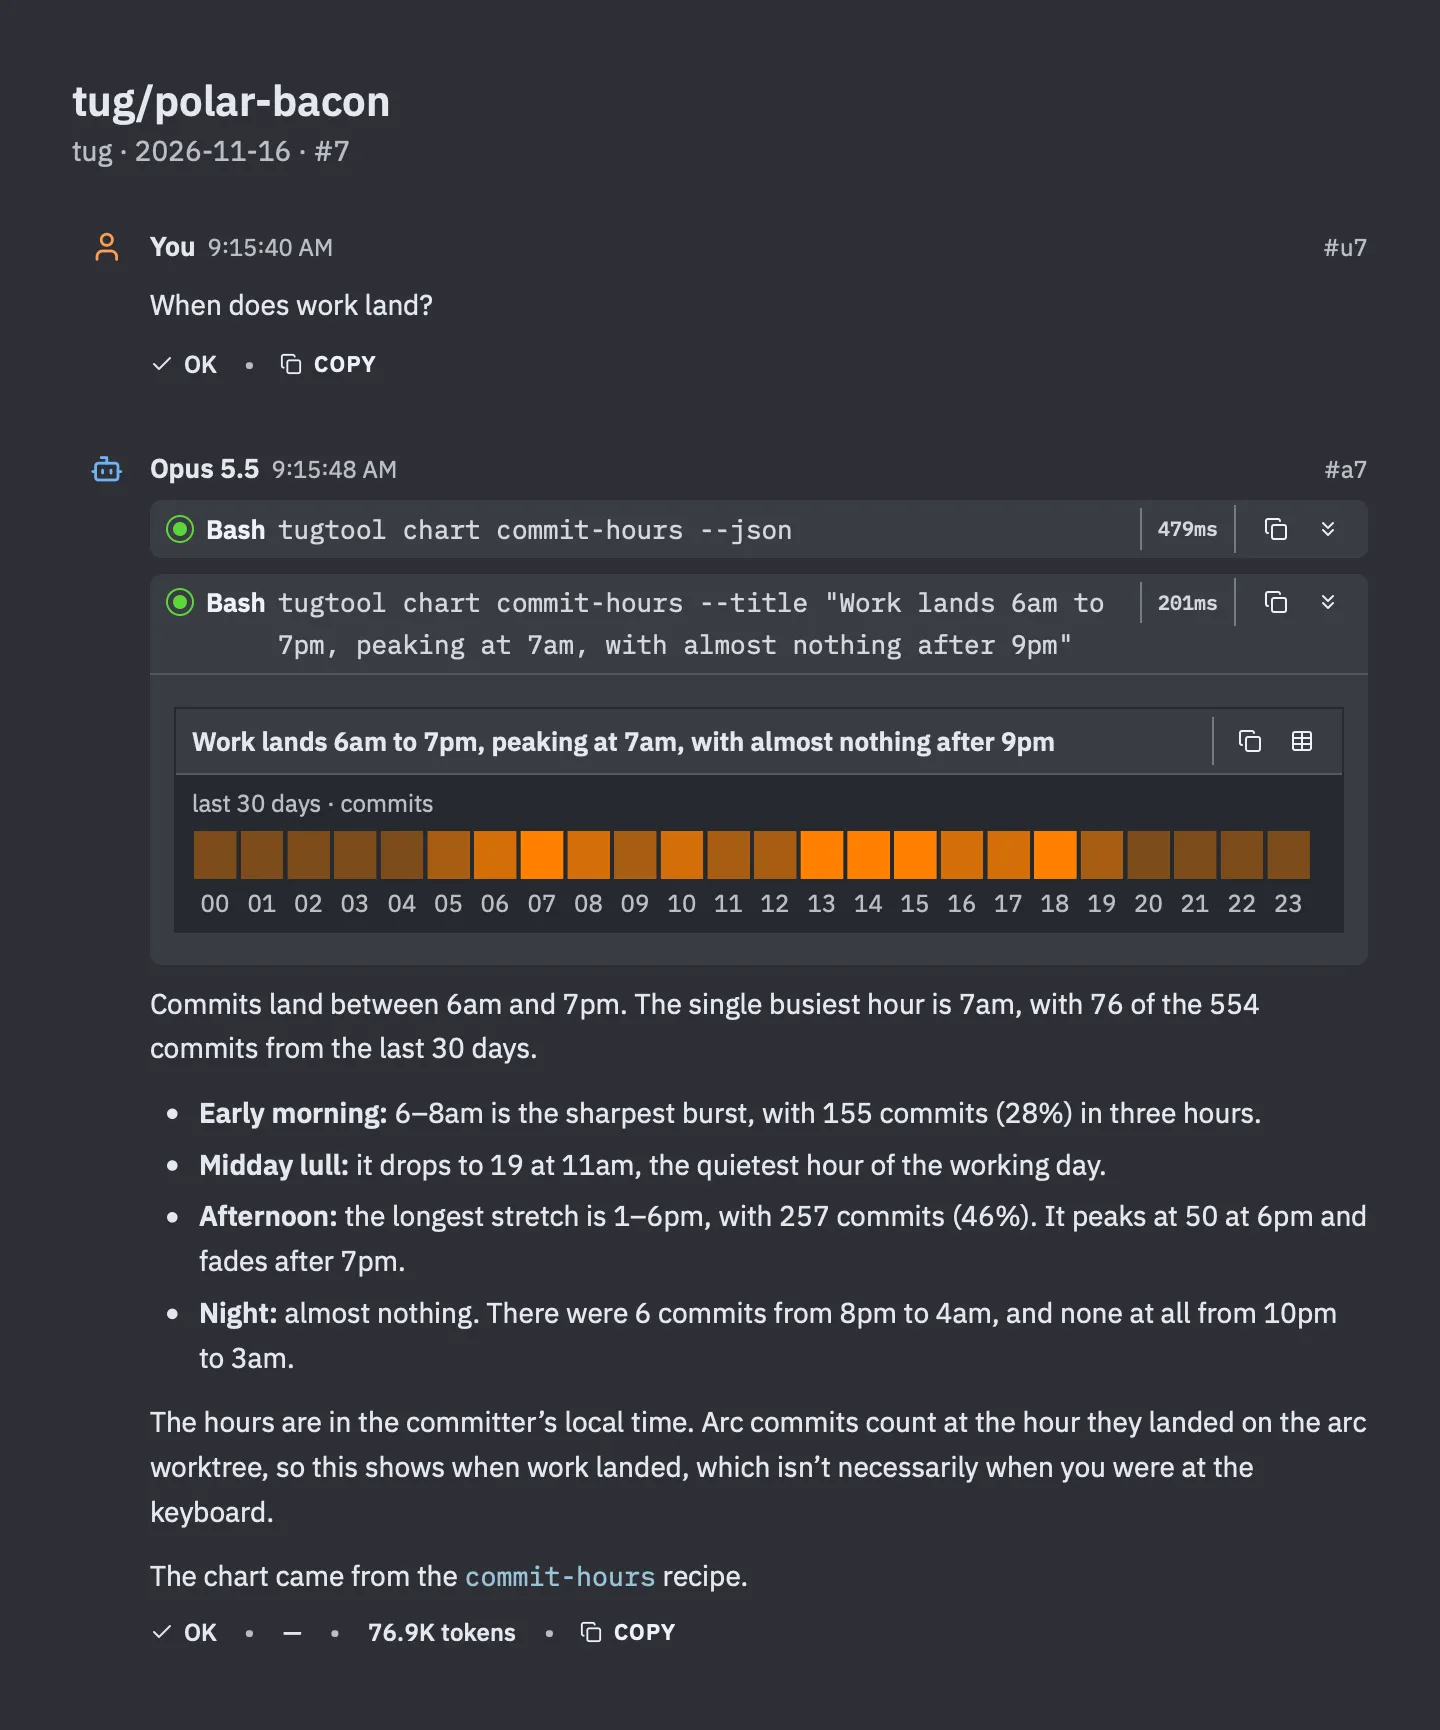
I’m a morning person, and now I have the chart to prove it. The busiest single hour is 7am. There’s a lull around 11 (that’s when I have lunch!), a long afternoon stretch that peaks at 6pm, and almost nothing at night. Zero commits between 10pm and 3am in a whole month. Good. ZZZzzz… 😴
How it works
Those six charts are six of eighteen. Tug calls them recipes: well-known charts it computes from the project’s own records, like the git history, the test results, and the record of every arc. Asking for the list gives the list.
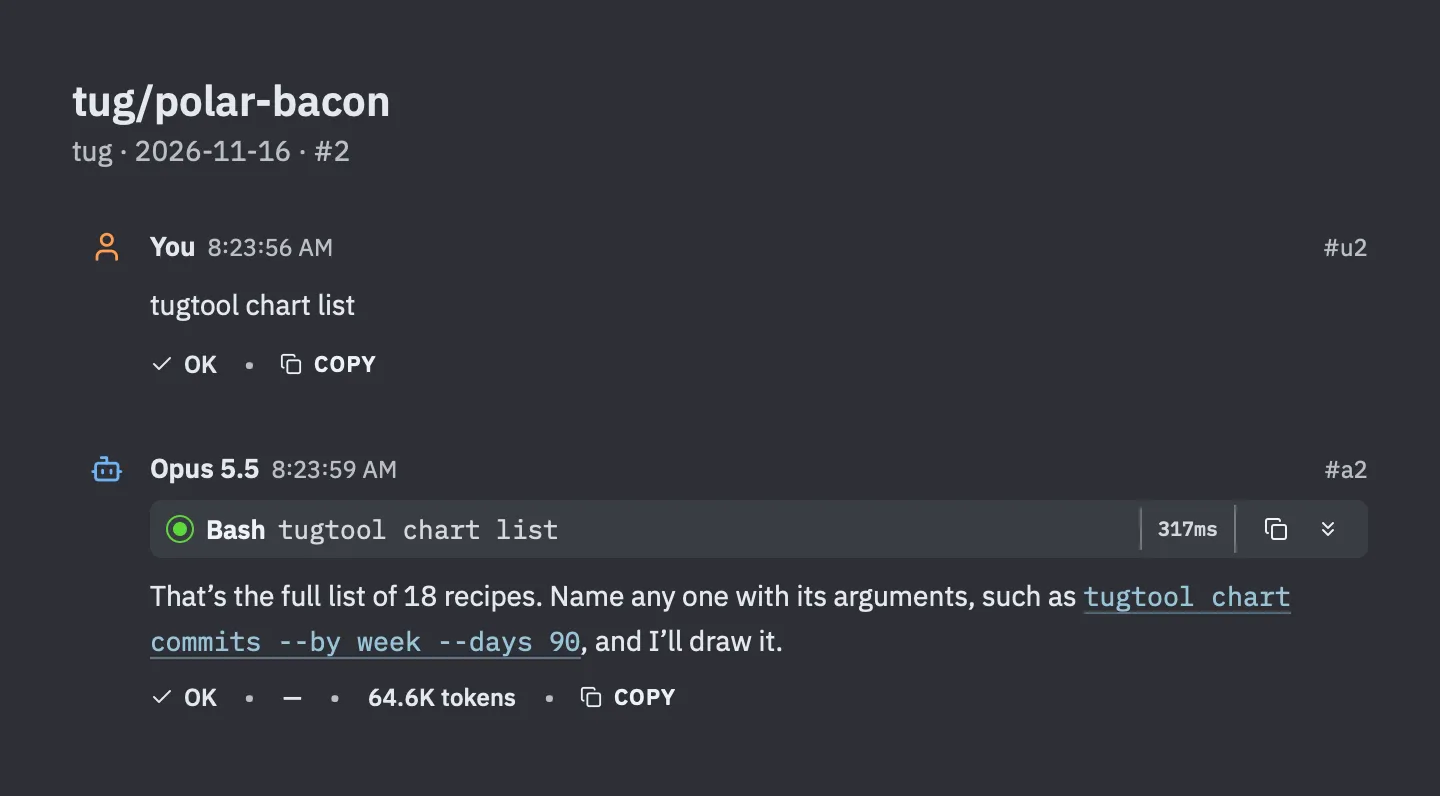
The others cover things like lines added and removed per day, how big commits tend to be, which days of the week are busiest, how long commands take, and how many tokens the work uses.
Recipes are the shortcut, not the limit. A chart in Tug is a small description of the data, and the AI can write one for any numbers it has in hand: a CSV file, a command’s output, figures from earlier in the conversation. Tug does the drawing. The chart picks up my theme, I can hover over any bar to read its value, and one click turns it into a table.
How these pictures were made
Every picture in this post was made with Share Turns, a feature that arrived in Tug 0.9.3, which I covered in A Whirlwind First Week. Each one is a prompt and its answer, rendered by Tug as an image, just as they look in the session card. So this post is two features showing each other off.
Tug draws diagrams too. Those are in Don’t Tell Me, Show Me: Diagrams That Explain Code.
Update
November 17, 2026. Two nice changes landed in Tug after I published this post.
First, there’s now a sheet that shows every recipe at once. It’s called Visualize Data. I open it with Control-Command-V, or from the Session menu, or by typing /visualize-data. (And honestly, the sheet was there in earlier releases… but I forgot it was there! Once I remembered, I went back and spruced it up!)
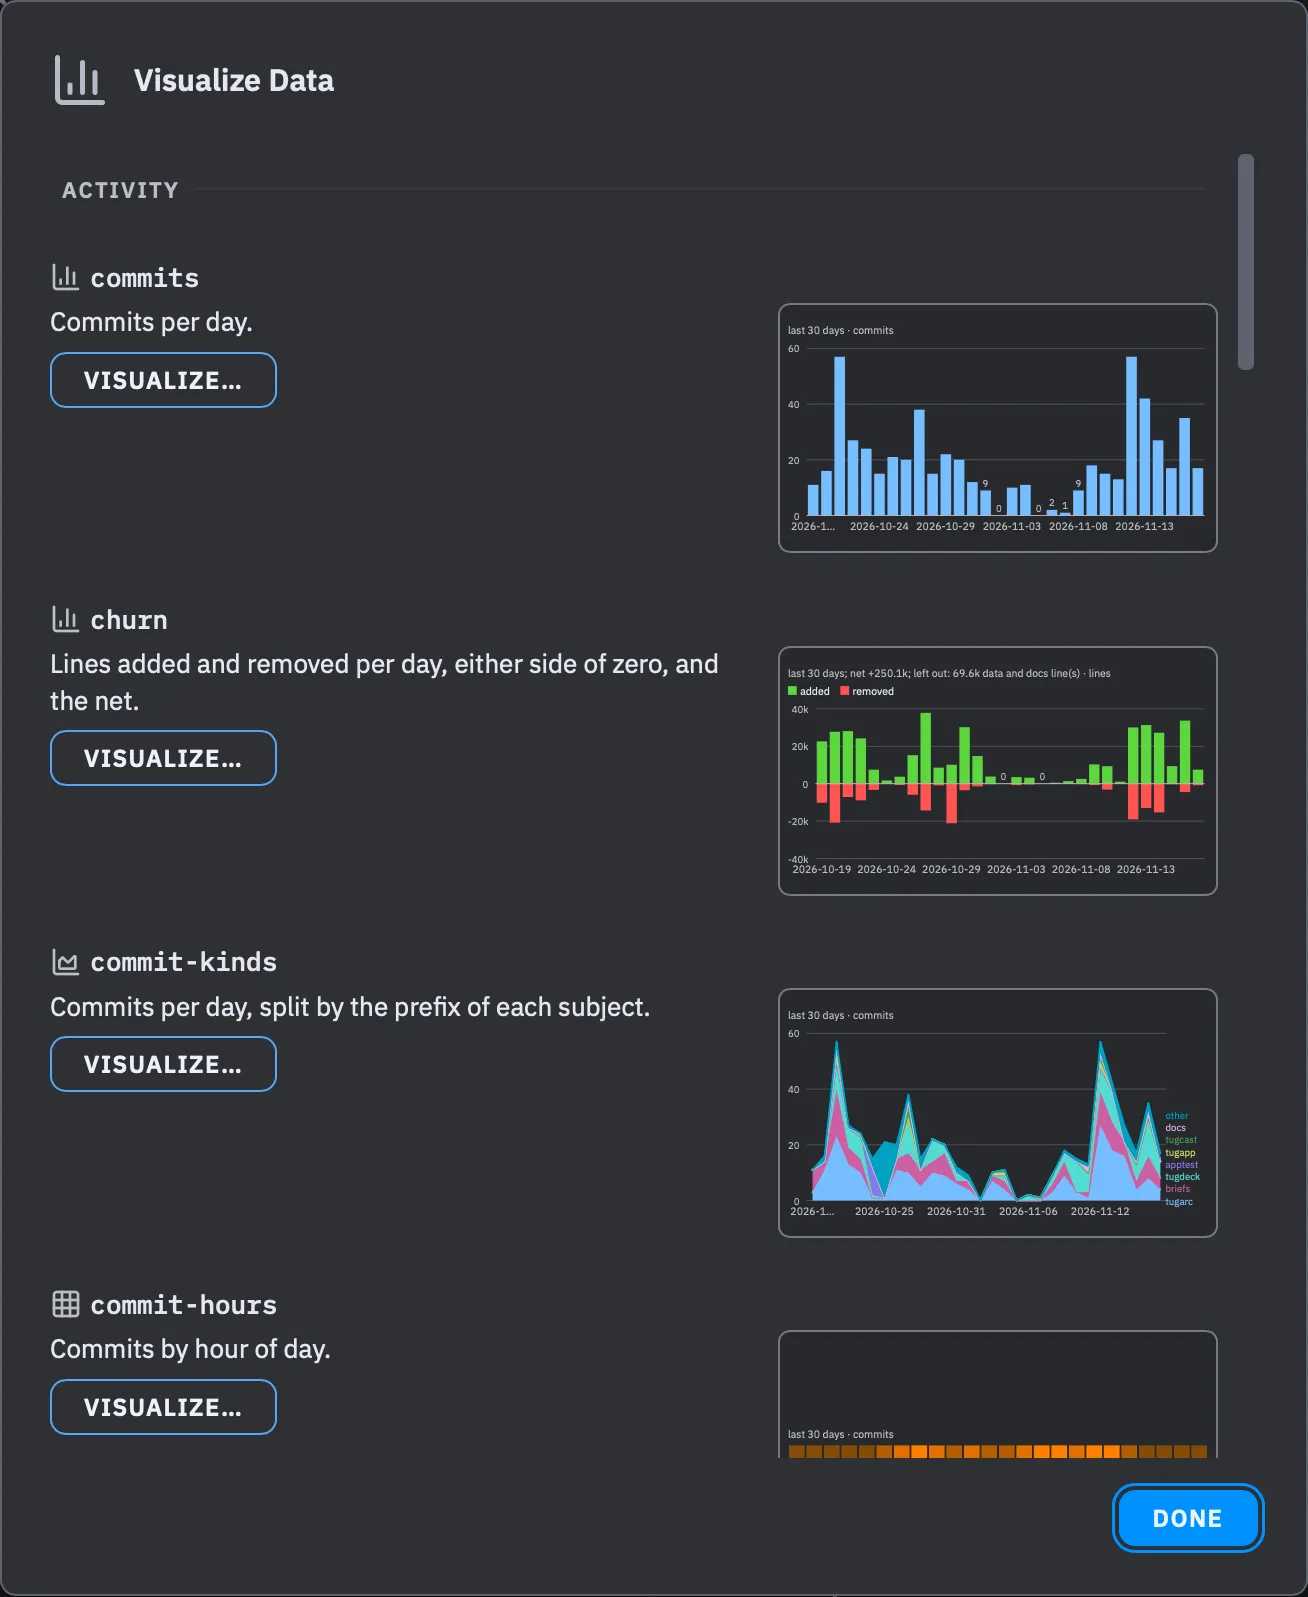
I love this sheet… just as much as the one for explaining code I added once I had this one! ❤️
Each recipe gets a row with a line on what its data tells, and next to it a small chart. That chart isn’t a stock picture. It’s drawn from the project I have open, so I can see what a recipe will show me before I ask for it. Clicking Visualize… puts the recipe’s command in the prompt, unsent, so I can add a number of days or a chart form before I press Return. The list has grown, too: the eighteen recipes I mentioned above are now twenty.
Second, the charts are no longer just pictures. I can click them to see more. This idea came from a social media comment. When I posted the commits chart on X, I got a question:
Right now, no. So, I accept this as a feature request. Will do. Thank you!
— Ken Kocienda (@kocienda) November 16, 2026
Great idea! Job’s done! 🛠️ In this example below, I clicked the bar for November 8, in the middle of that quiet week:
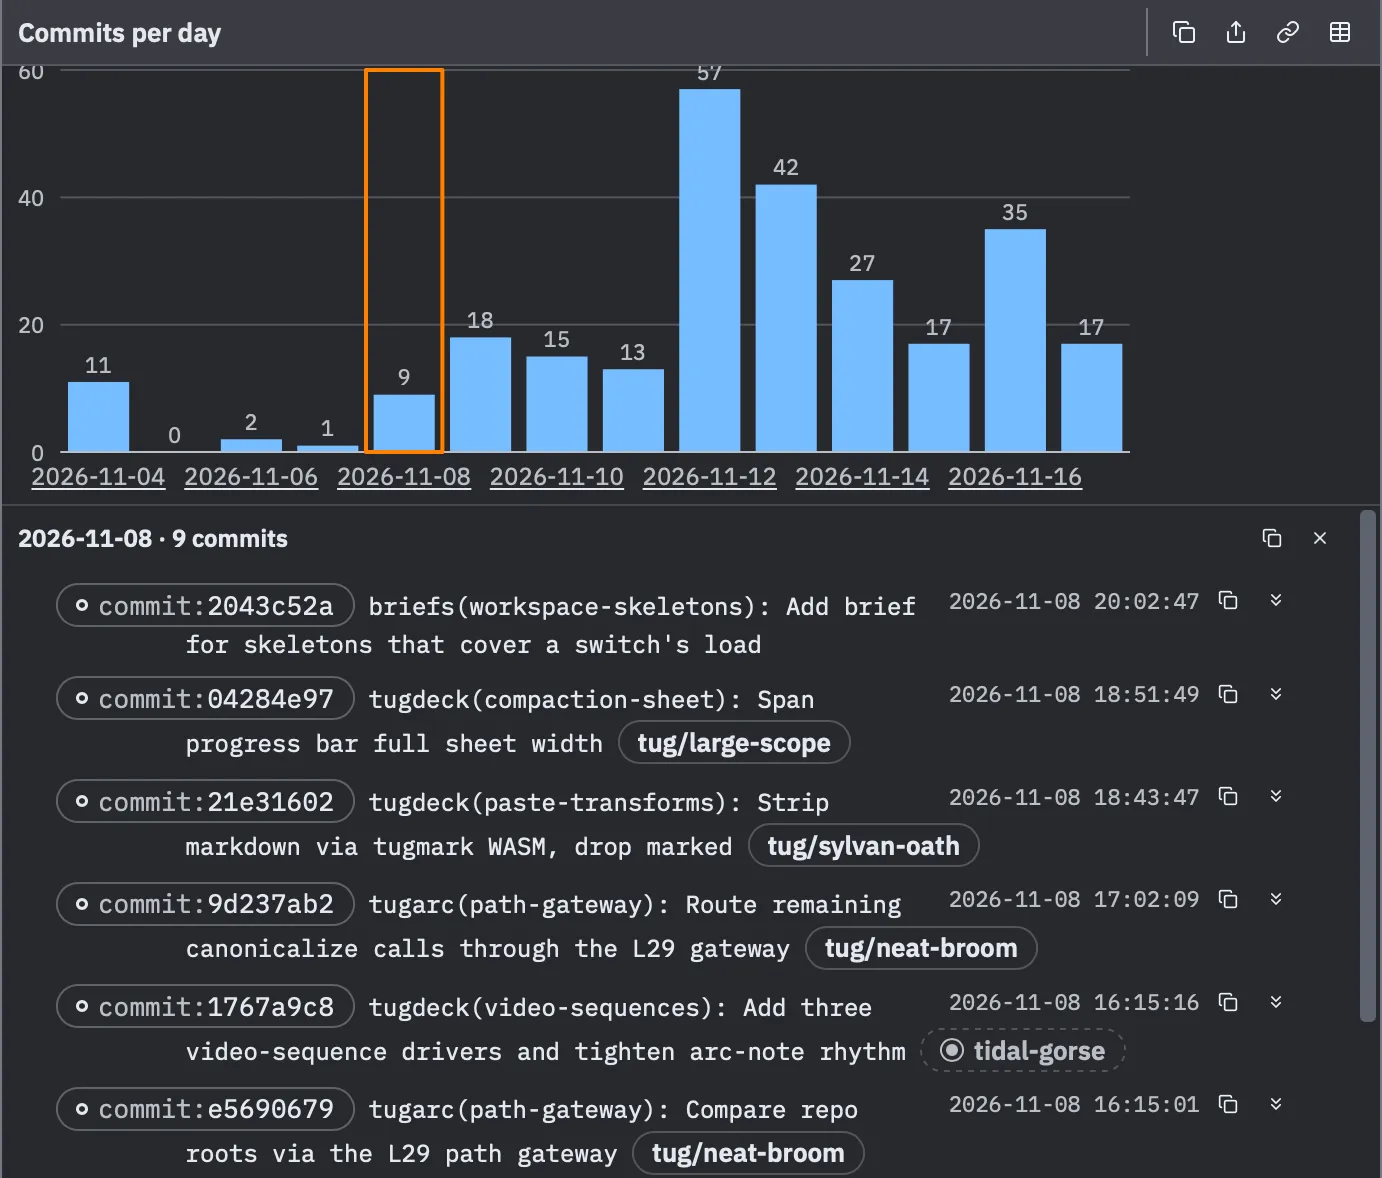
The nine commits behind that bar open right under the chart, each with its hash, its subject, the time it landed, and the session that made it. A row unfolds to the full message and the list of files it touched. So a chart is now a way in: I spot the odd day, click it, and I’m reading the commits.
Not limited to the commits chart either. A bar for a directory opens the files under it, a dot in the test history opens that one run, and a step in an arc’s timeline opens that stage. Not only fun to look at—but useful too!